Shilchar Technologies Limited

Initiation of coverage

Shilchar Technologies Limited

Capacity is the catalyst; execution and valuation set the limit

SHILCTECH.INNSE / BSEElectrical equipment - power and distribution transformers2026-07-30
Evidence-backed research POC. Model indication: HOLD; target INR 5,050. Rating pending analyst approval.

Contents

Research cut 2026-07-30T23:59:59+05:30. Report figures are model outputs unless explicitly labelled reported or preliminary.

01

Investment Summary

Capacity is the catalyst; execution and valuation set the limit

RatingHOLD
Target priceINR 5,050
Reference priceINR 4,484
Implied return12.6%

Shilchar enters FY2027 with visible demand, a debt-free balance sheet and a funded capacity step-up. The debate is no longer whether transformer demand exists, but how quickly the company can convert orders and new capacity without giving back its export-led margin gains.

What matters

Order visibility is real, but quarterly conversion is not smooth

The company entered FY2027 with an INR 452 crore order book and approximately INR 800 crore of full-year revenue visibility. That supports growth, but FY2026 Q4 showed that shipping disruption and export timing can move meaningful revenue between quarters.

FY2026 results call transcript

Expansion changes the addressable market

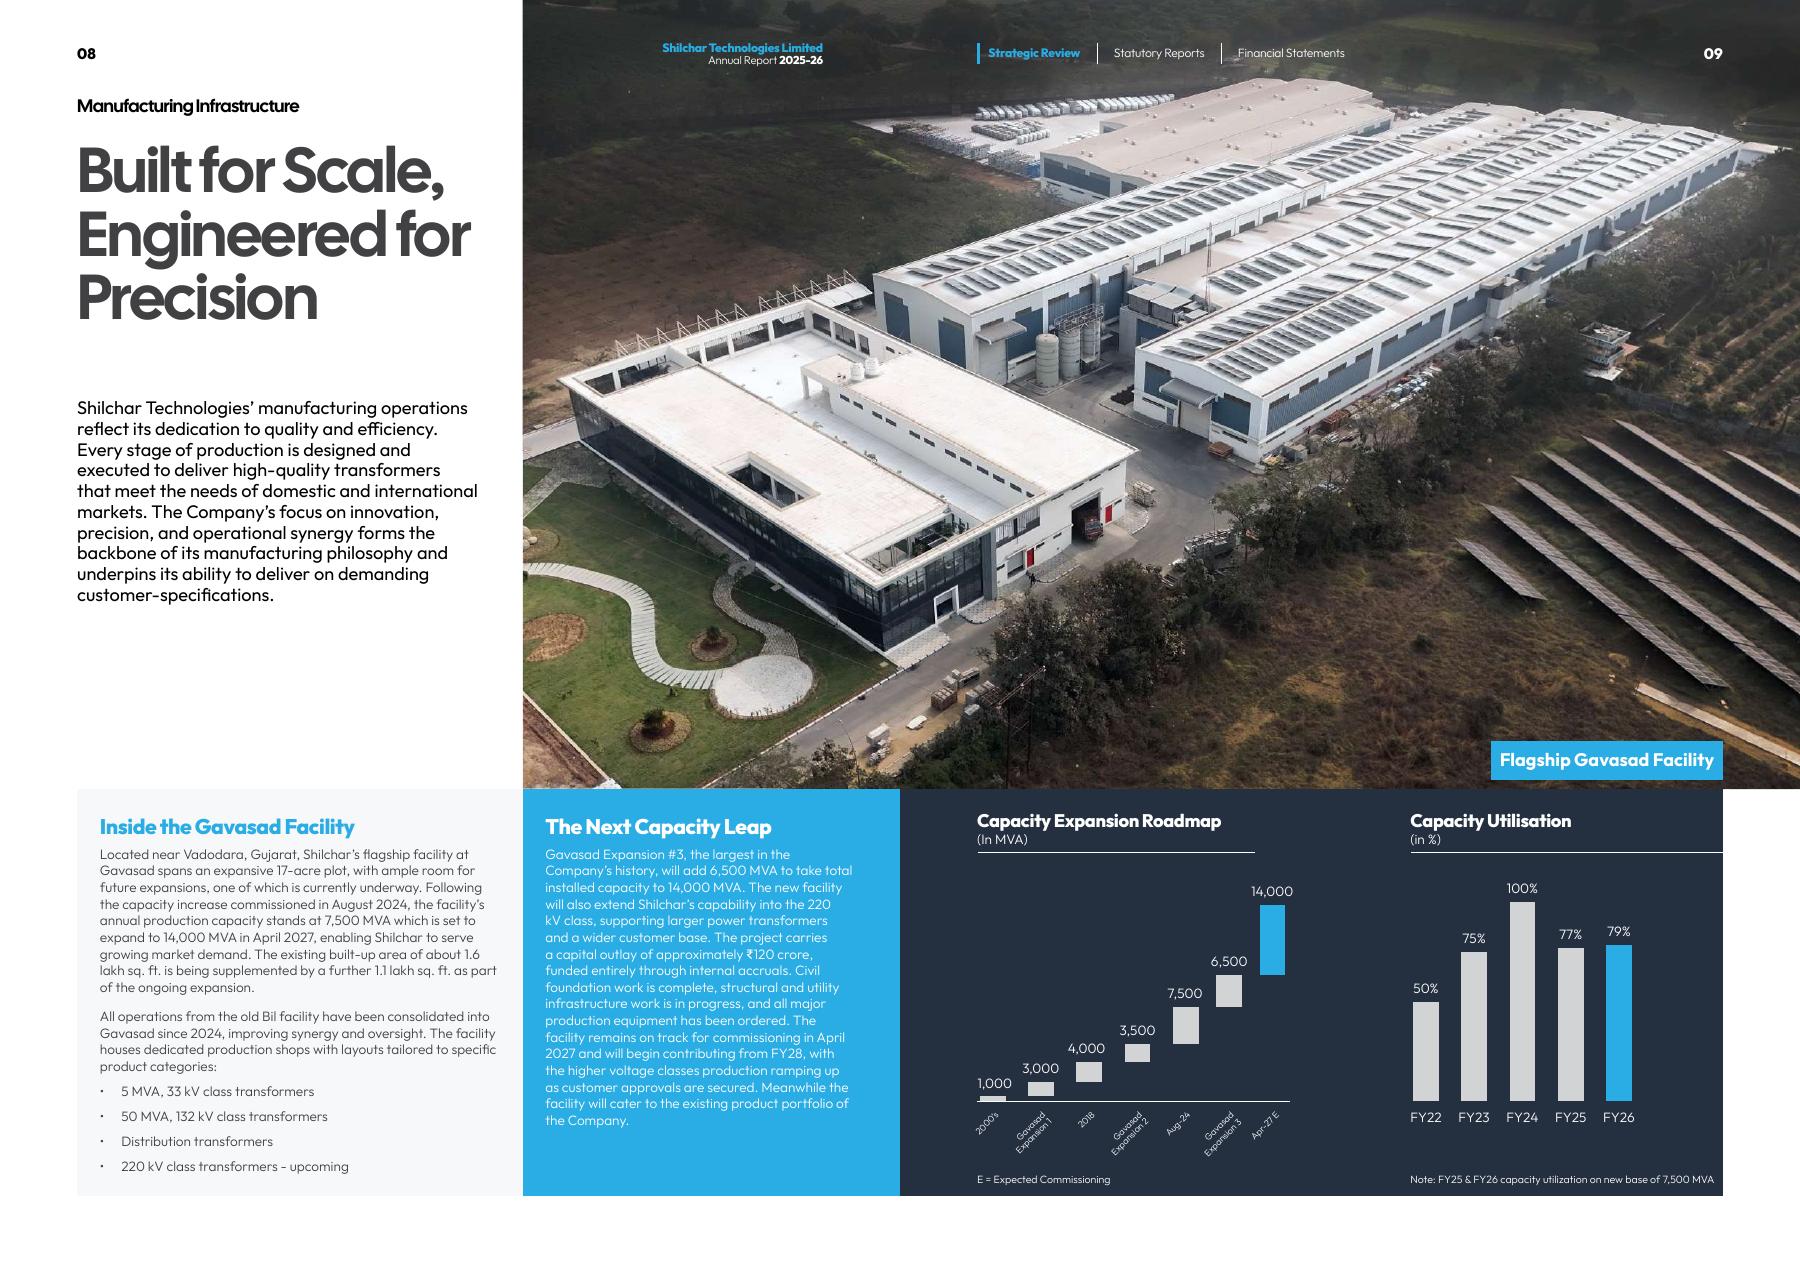
The INR 120 crore Gavasad project adds 6,500 MVA, takes stated capacity to 14,000 MVA and introduces 220 kV capability. Commissioning is targeted for April 2027; customer qualification means the revenue benefit should be weighted toward FY2028 rather than assumed immediately.

Shilchar Technologies Annual Report FY2025-26

Margin quality depends on mix and pass-through

Exports carry higher margin, while copper, CRGO and transformer oil can move faster than customer pricing. We therefore hold EBITDA margin below the FY2026 peak through the forecast rather than extrapolating a constant 29-30%.

FY2026 results call transcript

A strong company can still be fully valued

At the reference price, the market already discounts substantial capacity conversion. Our target is driven mainly by FY2028 earnings and only lightly by DCF, because a small change in long-run assumptions produces a wide DCF range.

Derived model output

Share-price history01,5743,1484,7226,2962025-012025-032025-042025-062025-072025-092025-102025-122026-012026-032026-042026-062026-072026-07Share price
Reference-price history. The valuation date is fixed; subsequent prices are not included.
PeriodRevenueGrowthEBITDA marginEPS
FY2027INR 8,000.0m22.7%28.0%160.84
FY2028INR 10,500.0m31.2%29.0%215.69
FY2029INR 12,500.0m19.0%28.5%251.31

The rating is a model indication pending analyst approval. It is not personalized investment advice.

02

Thesis and Variant View

The variant view is about conversion, not the existence of demand.

Order visibility is real, but quarterly conversion is not smooth

The company entered FY2027 with an INR 452 crore order book and approximately INR 800 crore of full-year revenue visibility. That supports growth, but FY2026 Q4 showed that shipping disruption and export timing can move meaningful revenue between quarters.

Expansion changes the addressable market

The INR 120 crore Gavasad project adds 6,500 MVA, takes stated capacity to 14,000 MVA and introduces 220 kV capability. Commissioning is targeted for April 2027; customer qualification means the revenue benefit should be weighted toward FY2028 rather than assumed immediately.

Margin quality depends on mix and pass-through

Exports carry higher margin, while copper, CRGO and transformer oil can move faster than customer pricing. We therefore hold EBITDA margin below the FY2026 peak through the forecast rather than extrapolating a constant 29-30%.

A strong company can still be fully valued

At the reference price, the market already discounts substantial capacity conversion. Our target is driven mainly by FY2028 earnings and only lightly by DCF, because a small change in long-run assumptions produces a wide DCF range.

03

Business Model

Shilchar designs and manufactures made-to-order power and distribution transformers for renewable generation, utilities and industrial customers. Its Gavasad plant supplies domestic and export markets, with engineering and testing retained in-house and selected lower-value components outsourced.

Business lineWhat it doesPrimary earnings driver
Power and distribution transformersCustom transformers for utilities, industrial plants and renewable projects; approximately 95% of turnover in public disclosures.Order intake, MVA throughput, product mix and export share
Renewable-energy transformersInverter-duty and generator transformers used in solar, wind and hydro applications.Renewable additions, grid connection schedules and EPC execution
Electronics and telecom transformersLegacy R-core and ferrite capabilities that demonstrate engineering breadth but are not the principal earnings engine.Niche demand and engineering continuity
Gavasad manufacturing facility and scale-up context
Gavasad manufacturing facility and scale-up context. Source: Shilchar Technologies Annual Report FY2025-26, p. 6.
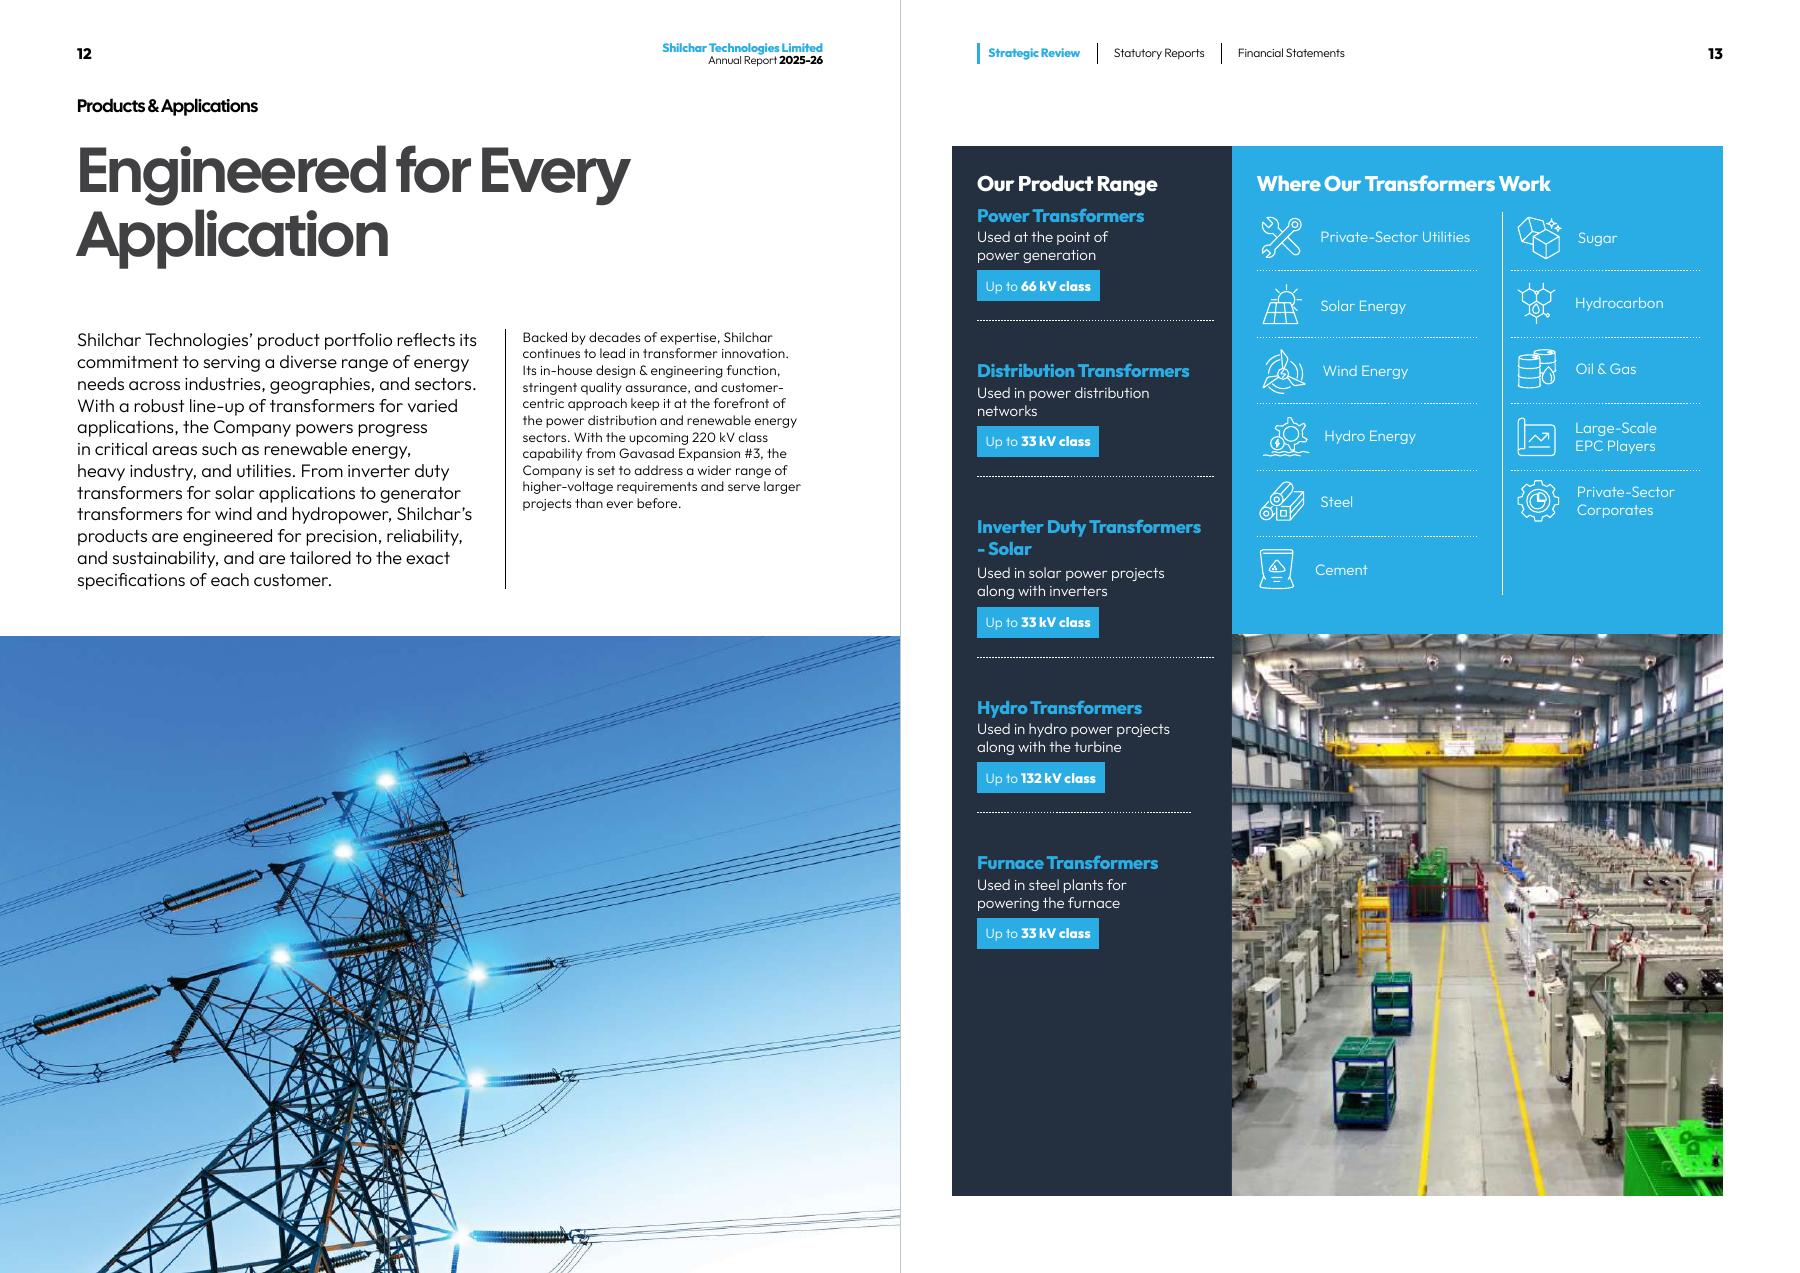
Transformer applications and engineering capabilities
Transformer applications and engineering capabilities. Source: Shilchar Technologies Annual Report FY2025-26, p. 8.
04

Company Operating Map

A compact view of how products, capacity, counterparties and risks connect to the financial model.

Reviewed company operating mapShilchar Technologies Limited - Outsources To Provider - Domestic lower-value component suppliersShilchar Technologies Limited - Has Business Driver - Gavasad capacity expansionPower and Distribution Transformers - Offers Product Or Platform - Power TransformersGavasad Expansion 3 - Offers Product Or Platform - 220 kV class transformersShilchar Technologies Limited - Depends On Resource - Cold-rolled grain-oriented electrical steelPower and Distribution Transformers - Offers Product Or Platform - Distribution TransformersShilchar Technologies Limited - Serves Customer Type - Private utility companiesShilchar Technologies Limited - Operates Facility - Gavasad manufacturing facilityShilchar Technologies Limited - Offers Product Or Platform - Distribution TransformersShilchar Technologies Limited - Has Business Driver - Global transformer supply shortageShilchar Technologies Limited - Exposed To Risk Factor - West Asia shipping disruptionShilchar Technologies Limited - Offers Product Or Platform - Power TransformersShilchar Technologies Limited - Depends On Resource - CopperShilchar Technologies Limited - Has Business Division - Power and Distribution TransformersShilchar Technologies Limited - Exposed To Risk Factor - Raw-material price volatilityShilchar Technologies Limited - Exposed To Risk Factor - United States tariff policyPower and Distribution Transformers - Offers Product Or Platform - Furnace TransformersShilchar Technologies Limited - Depends On Resource - Transformer oilShilchar Technologies Limited - Exposed To Risk Factor - Foreign-exchange volatilityShilchar Technologies Limited - Operates Facility - NABL-accredited testing laboratoryShilchar Technologies Limited - Uses Product - Solid Edge 3D design softwarePower and Distribution Transformers - Offers Product Or Platform - Hydro TransformersShilchar Technologies Limited - Serves End Market - Hydropower projectsShilchar Technologies Limited - Operates Facility - Gavasad Expansion 3Shilchar Technologies Limited - Has Business Driver - Grid and renewable capacity expansionShilchar Technologies Limited - Has Business Division - Electronics and Telecom TransformersShilchar Technologies Limited - Serves Customer Type - Large-scale EPC contractorsShilchar Technologies Limited - Serves End Market - Data centresShilchar Technologies Limited - Serves Customer Type - Renewable-energy developersShilchar Technologies Limited - Has Business Driver - AI data-centre power investmentShilchar Technologies Limited - Serves End Market - Cement, oil and gas industriesShilchar Technologies Limited - Uses Product - SAP ERPShilchar48 nodes / 49 linksPower and Distribution ...Cement, oil and gas ind...Data centresElectronics and Telecom...Hydropower projectsDistribution TransformersPower Transformers220 kV class transformersFurnace TransformersHydro TransformersLarge-scale EPC contrac...Private utility companiesRenewable-energy develo...Gavasad Expansion 3Gavasad manufacturing f...NABL-accredited testing...SAP ERPSolid Edge 3D design so...Cold-rolled grain-orien...CopperDomestic lower-value co...Transformer oilAI data-centre power in...Gavasad capacity expans...Global transformer supp...Grid and renewable capa...Foreign-exchange volati...Raw-material price vola...United States tariff po...West Asia shipping disr...
Reviewed presentation graph. No relationship is inferred solely to increase density.
Driver to financial metric mapBusiness driversFinancial compartmentsForecast metricsGrid and renewable capacity inves...Order-book conversion and dispatc...Gavasad capacity expansion and qu...Copper and CRGO cost with pass-th...Export mix, tariffs and shipping ...AI data-centre power infrastructu...Order intakeOrder bookRevenueReceivablesWorking capitalCapital expenditureProduction capacityRevenueAdjusted EPSGAAP EPS
Driver paths describe a financial mechanism, not proven causality. Only reviewed driver-to-financial mappings enter the forecast; a graph connection alone never creates an earnings adjustment.
05

Industry and Demand

Indian grid expansion and renewable additions require transmission and transformation equipment, while global replacement demand has kept transformer lead times firm.

The supply response matters. Domestic and global manufacturers are expanding capacity, so the long-run thesis cannot rely indefinitely on scarcity pricing.

AI data-centre investment is a plausible demand adjacency, not a booked Shilchar revenue stream. It remains outside the base case until qualified orders or customer evidence is disclosed.

Reviewed driver importance0%28%55%83%111%97.0%Grid and renewable95.0%Order-book convers92.0%Gavasad capacity e88.0%Copper and CRGO co84.0%Export mix, tariff68.0%AI data-centre pow
Monitoring priorities derived from filings, operating disclosures and the reviewed company graph.
06

Products and End Markets

Product or marketRoleWhy it matters
Cement, oil and gas industriesProcess-industry customer groupIndustrial project spending and replacement cycles diversify demand beyond utilities and renewables.
cement sectorEnd marketDemand, technology cycles, customer investment, regulation, and competitive intensity in this market can affect orders, mix, utilization, and revenue growth.
Data centresEmerging power-infrastructure end marketNew data-centre capacity can broaden transformer demand beyond traditional utility and renewable projects, but disclosed company-specific order exposure must be verified.
Hydropower projectsRenewable-generation end marketHydro project awards diversify the renewable portfolio, but projects are typically bespoke and schedule dependent.
National and internationallyEnd marketDemand, technology cycles, customer investment, regulation, and competitive intensity in this market can affect orders, mix, utilization, and revenue growth.
power production sectorEnd marketDemand, technology cycles, customer investment, regulation, and competitive intensity in this market can affect orders, mix, utilization, and revenue growth.
Solar power projectsRenewable-energy end marketUtility-scale solar additions, grid-connection spending and inverter specifications influence product demand.
Steel plantsHeavy-industrial end marketSteel-sector capital expenditure, furnace utilisation and energy-efficiency upgrades shape demand for this specialised product.
Wind power projectsRenewable-energy end marketNew wind capacity and repowering programs support demand, subject to project schedules and customer qualification.
wind, solar & hydro projectsEnd marketDemand, technology cycles, customer investment, regulation, and competitive intensity in this market can affect orders, mix, utilization, and revenue growth.
220 kV class transformersHigher-voltage transformer rangeSuccessful qualification can increase addressable order size and market reach, but requires commissioning discipline, testing capability and customer approvals.
Distribution TransformersElectricity-distribution productUtility upgrades, loss-reduction programs, electrification and replacement demand support orders, while tender pricing can affect margins.
Furnace TransformersHigh-current industrial transformerSteel and industrial capital spending, custom specifications and energy-efficiency requirements shape demand.
Hydro TransformersHydroelectric generation transformerHydropower investment broadens the renewable order base, but project timing and long approval cycles can make deliveries uneven.
Inverter Duty TransformersSolar inverter interface transformerDemand follows utility-scale solar additions, while thermal design, harmonic tolerance and project qualification support product differentiation.
Power TransformersGeneration and transmission transformer productGrid investment, voltage-class qualification, order size and execution complexity drive demand and margins.
Renewable Energy TransformersSolar, wind and hydro transformer productsRenewable capacity additions, project commissioning and grid-connection requirements are direct demand drivers.
solar and windmill transformersProduct or platformThe connection identifies a commercial capability that may support customer adoption and revenue; its financial contribution remains unquantified unless the source separately discloses sales or margins.
Transformer applications and engineering capabilities
Transformer applications and engineering capabilities. Shilchar Technologies Annual Report FY2025-26.
07

Customers, Exports and Routes to Market

Public disclosures support customer types, channels and selected counterparties; they do not support a complete customer roster or private contract economics.

RelationshipRoleCompany relevance
Large-scale EPC contractorsEngineering and project-delivery customer groupApproved-vendor status and repeat EPC relationships can broaden market access, while project delays and negotiated pricing affect order conversion.
Private utility companiesElectricity-network customer groupUtility capital expenditure, tender pipelines, technical approvals and payment terms influence orders and working capital.
Renewable-energy developersSolar, wind and hydro customer groupProject awards and commissioning schedules are direct demand drivers for Shilchar's inverter-duty and generator-transformer products.
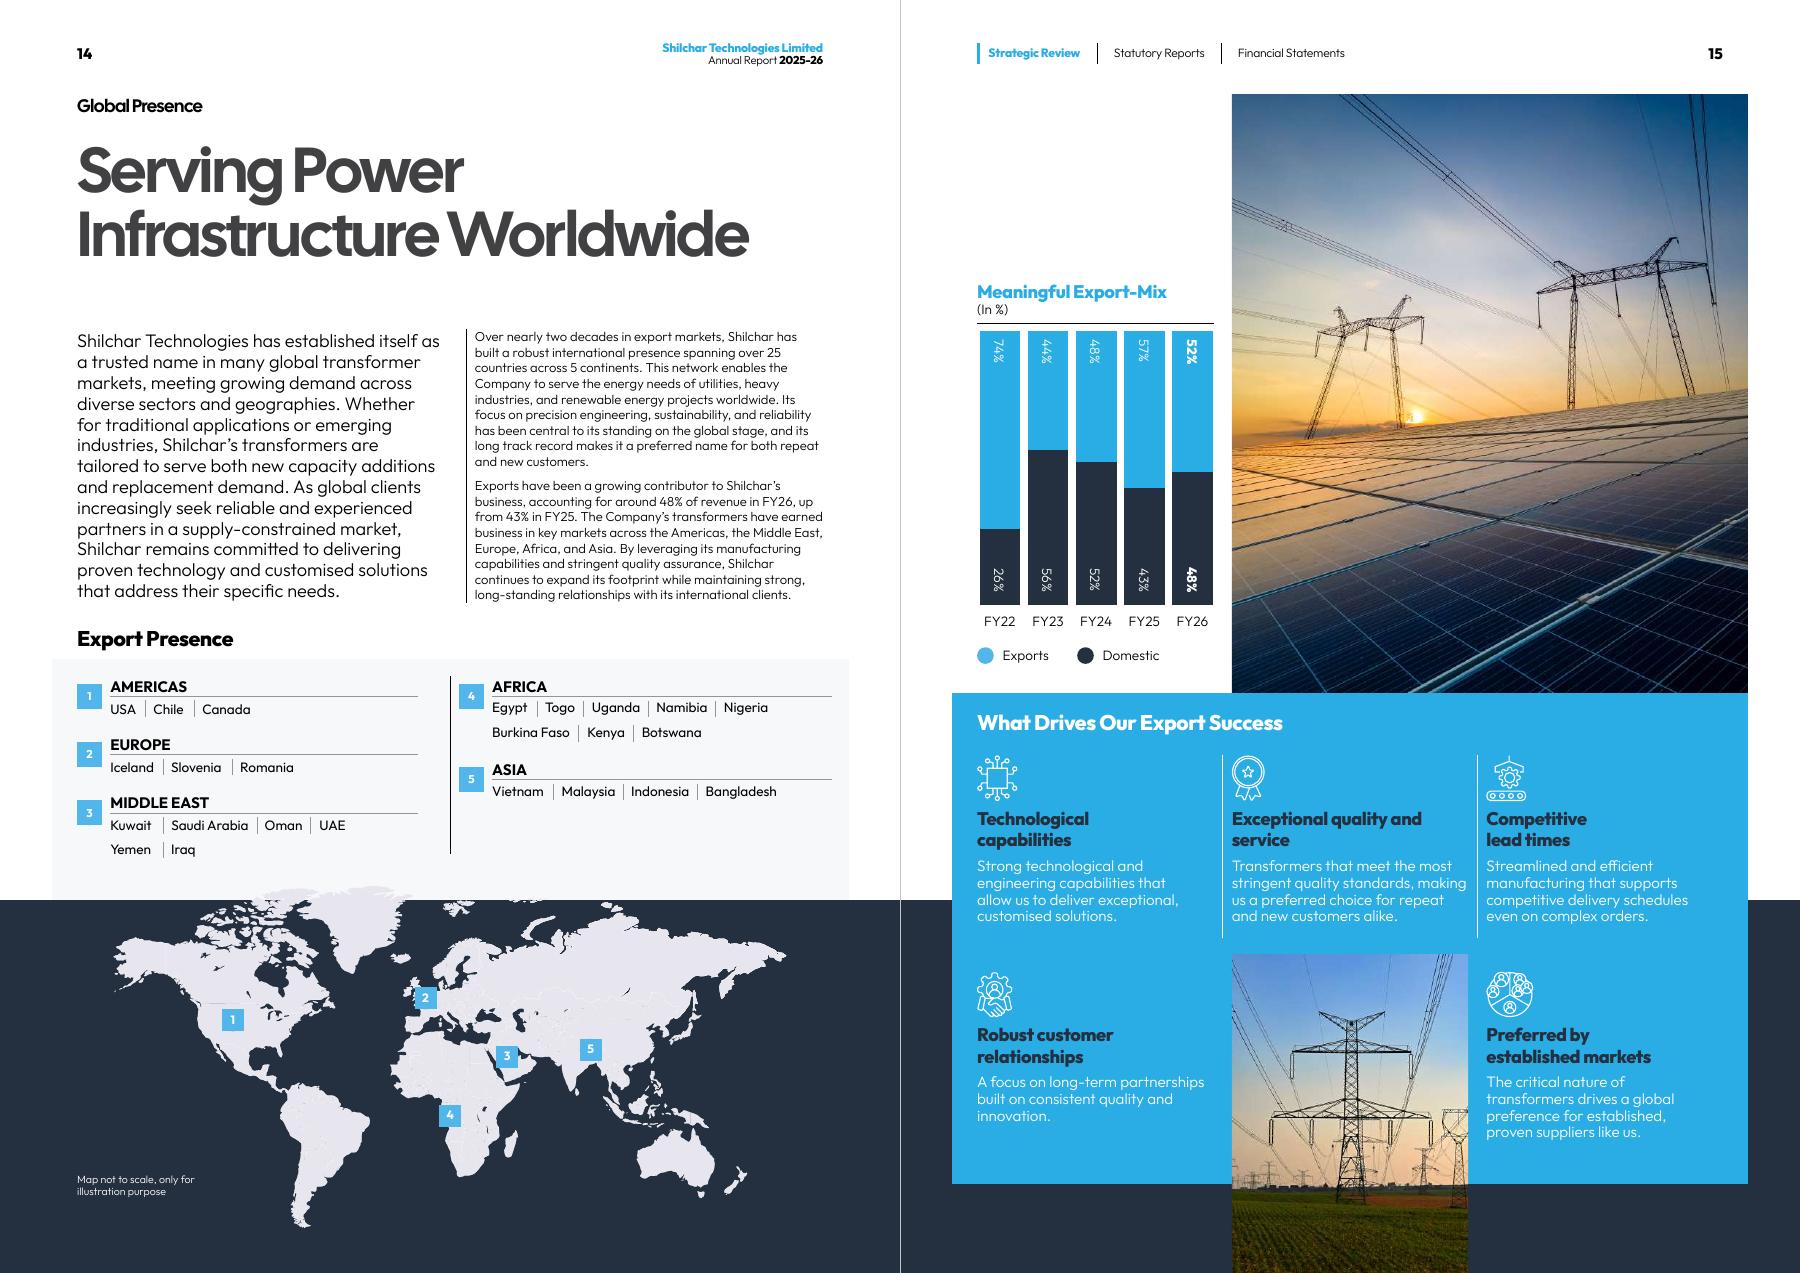
AfricaExport regionGrid expansion creates opportunity, though project funding, counterparty risk and logistics require careful order selection.
AmericasExport regionThe region contributes export opportunity and attractive product mix, while tariffs, qualification and shipping conditions affect conversion.
AsiaExport and operating regionRegional electrification and renewable investment support demand, while local competition and procurement cycles affect pricing.
EuropeExport regionEuropean grid and renewable investment diversifies demand, but standards compliance and long logistics routes influence execution.
Middle EastExport regionRegional investment supports growth, while conflict and shipping disruption can defer dispatches and quarterly revenue recognition.
National (No. of States) 22Operating geographyOperations in this geography can create exposure to local demand, regulation, currency, labor, tax, political conditions, and execution risk.
Export footprint and end-market reach
Export footprint and end-market reach. Shilchar Technologies Annual Report FY2025-26.
08

Operations, Capacity and Supply Chain

Asset, input or providerRoleOperational significance
Gavasad Expansion 3Next capacity-expansion projectCommissioning timing, customer approvals, capital spending and order conversion determine whether the project supports the expected growth from FY2028.
Gavasad manufacturing facilityPrimary manufacturing siteUtilisation, throughput, testing capacity, labour and supply continuity at this site directly affect deliveries, fixed-cost absorption and working capital.
NABL-accredited testing laboratoryIn-house transformer testing facilityIn-house accredited testing supports product qualification, delivery reliability and entry into higher-voltage and export markets.
Cold-rolled grain-oriented electrical steelSpecialised transformer-core steelThe material is specialised and substantially imported, so price, lead time, foreign exchange and supplier availability influence cost and production continuity.
CopperTransformer winding materialCopper price, availability and procurement timing affect material cost, working capital and margins on fixed-price orders.
Transformer oilElectrical insulation and cooling fluidOil quality and continuity of supply are essential to transformer reliability, while price movements can affect material cost and order margins.
SAP ERPEnterprise operations platformReliable planning and traceability are important when each transformer is engineered to order and uses long-lead materials.
Solid Edge 3D design softwareTransformer engineering toolDigital design supports customisation, drawing control and manufacturability as Shilchar moves into larger and higher-voltage products.
Domestic lower-value component suppliersOutsourced component supply baseThe model supports capacity flexibility, but supplier quality, delivery performance and component availability still affect throughput.
09

Historical Financials

PeriodRevenueEBITDANet incomeEPS
FY2024INR 3,972.2mINR 1,072.0mINR 916.0m80.07
FY2025INR 6,231.5mINR 1,840.0mINR 1,468.7m128.38
FY2026INR 6,519.4mINR 1,900.0mINR 1,581.6m138.25
Revenue history and forecast04,1528,30512,45816,610FY24FY25FY26FY27FY28FY29FY30FY31Revenue
Solid line combines reported history and analyst forecasts; the boundary is identified in the table and methodology.
EPS history and forecast080160240319FY24FY25FY26FY27FY28FY29FY30FY31EPS
Per-share history follows the stated share basis in the source records.
10

Forecast Framework

A statistical control and a separate analyst driver model are kept visible.

Revenue = demand x addressable exposure x order conversion x capacity realizationEBITDA = Revenue x EBITDA marginEPS = Net income / diluted sharesFCFF = EBIT x (1 - tax) + D&A - capex - change in working capital

Point-in-time control model

MetricSelected modelPeriodsWAPEBiasInterval coverage
GAAP diluted EPSrobust_ensemble323.7%11.6%66.7%
Net incomerobust_theil_sen320.0%20.0%66.7%
Revenuerobust_theil_sen39.0%9.0%66.7%

The control is selected through expanding-window backtesting. Small samples make these diagnostics descriptive rather than conclusive. The annual analyst case uses operating evidence and does not overwrite the frozen control.

Annual assumption bridge

YearRevenue growthEBITDA marginNet marginCapex / revenueBasis
FY202722.7%28.0%23.0%15.0%Management's INR 800 crore revenue visibility; near-full use of existing capacity; expansion capex
FY202831.2%29.0%23.5%4.0%First meaningful year of Gavasad Expansion 3; qualification and utilization ramp
FY202919.0%28.5%23.0%3.0%Higher 220 kV mix and broader capacity utilization with moderate normalization
FY203012.0%28.0%22.5%3.0%Maturing capacity and more competitive transformer supply
FY20317.9%27.0%22.0%3.0%Steady-state growth and conservative margin normalization
11

Financial Forecasts

YearRevenueEBITDAEBITNet incomeEPSFCFF
FY2027INR 8,000.0mINR 2,240.0mINR 2,080.0mINR 1,840.0m160.84INR 200.0m
FY2028INR 10,500.0mINR 3,045.0mINR 2,835.0mINR 2,467.5m215.69INR 1,601.2m
FY2029INR 12,500.0mINR 3,562.5mINR 3,312.5mINR 2,875.0m251.31INR 2,046.9m
FY2030INR 14,000.0mINR 3,920.0mINR 3,640.0mINR 3,150.0m275.34INR 2,310.0m
FY2031INR 15,100.0mINR 4,077.0mINR 3,775.0mINR 3,322.0m290.38INR 2,378.2m
Revenue history and forecast04,1528,30512,45816,610FY24FY25FY26FY27FY28FY29FY30FY31Revenue
Revenue forecast with the research-cut boundary disclosed in the table.
Forecast margins0%8%16%24%32%FY27FY28FY29FY30FY31EBITDA marginNet margin
Margins are not held at a peak indefinitely; the model allows normalization as industry capacity expands.

EPS follows modeled net income and diluted shares without a manual override; the full series is shown in the table above.

12

Valuation

The target blends a forward earnings multiple with a lower-weight DCF cross-check.

MethodKey assumptionValue per shareWeight
Forward P/EFY2028 EPS 215.69 at 25.0xINR 5,39290.0%
DCFWACC 13.0%; terminal growth 5.0%INR 2,18210.0%
Blended targetRounded under house policyINR 5,050100.0%

DCF sensitivity

WACC / g3.5%4.0%5.0%5.5%6.0%
11.5%INR 2,284INR 2,396INR 2,672INR 2,845INR 3,048
12.5%INR 2,035INR 2,120INR 2,323INR 2,447INR 2,590
13.0%INR 1,930INR 2,005INR 2,182INR 2,288INR 2,409
13.5%INR 1,836INR 1,902INR 2,057INR 2,149INR 2,253
14.5%INR 1,673INR 1,726INR 1,847INR 1,918INR 1,997

Scenarios

ScenarioProbabilityEPS factorP/ETargetReturnCase
Bear25.0%0.80x19.0xINR 3,300-26.9%Expansion or qualification delay, weaker export mix and incomplete raw-material pass-through.
Base55.0%1.00x25.0xINR 5,40020.3%FY2027 visibility converts and new capacity ramps through FY2028 without structural margin loss.
Bull20.0%1.12x29.0xINR 7,00056.2%Faster 220 kV qualification, strong export mix and sustained industry supply tightness.

DCF terminal value and the chosen P/E multiple are assumptions, not observed facts. The rating remains pending analyst approval.

13

Scenarios, Catalysts and Risks

Expansion and qualification delay

Medium probability / High impact. A delay pushes 220 kV and incremental MVA revenue beyond FY2028 while depreciation and committed capital begin earlier.

Valuation impact: A 20% reduction in FY2028 EPS and 19x P/E underpins the bear case.

Mitigation: Internally funded project, equipment ordered and civil work already advanced.

Export timing, tariffs and shipping

Medium probability / Medium impact. Delayed higher-margin exports move revenue between quarters and reduce mix-led EBITDA margin.

Valuation impact: A 200 bp margin reduction lowers FY2028 EPS by roughly 8-9% before secondary effects.

Mitigation: Diversified exports across more than 25 countries and resumed Middle East dispatches.

Copper, CRGO and transformer-oil inflation

High probability / Medium impact. Input costs are incurred before dispatch; incomplete or delayed indexation compresses gross margin and raises working capital.

Valuation impact: A 100 bp net-margin loss reduces FY2028 EPS by about INR 9 per share.

Mitigation: Variable-price contracts and quoting new inquiries at current input costs.

Customer and order concentration

Low-Medium probability / High impact. Large project orders and qualification cycles can create lumpy dispatches even when annual demand is healthy.

Valuation impact: A 10% shortfall in FY2027 revenue lowers base EPS by about INR 16 before cost action.

Mitigation: Domestic/export mix and multiple utility, renewable and EPC customer types.

Catalyst register

CatalystTimingEvidence to watchFinancial link
FY2027 order conversionQuarterly through FY2027Progress toward INR 800-850 crore management objectiveRevenue and fixed-cost absorption
Gavasad Expansion 3 commissioningApril 2027 targetPhysical completion, trial production and qualification updatesCapacity, capex, depreciation and FY2028 revenue
220 kV customer qualificationFY2028Approved-vendor status or disclosed ordersAddressable market and product mix
Export mix normalizationNear termDispatch recovery and export shareRevenue timing and EBITDA margin

Recent monitored events

DateEventDirectionImpact scoreForecast actionSource
2026-06-12Hitachi Energy announces investment in a new large-power-transformer factory in Indiapositive0.26monitorHitachi Energy India / NSE filing
2026-05-04Shilchar Technologies Limited reports financial results for FY2026 Q4uncertain0.71baseline_revision_candidateShilchar Q4 and FY2026 audited financial results
2026-04-10India plans substantial transmission and transformation-capacity expansion by 2032mixed0.22monitorPress Information Bureau / Ministry of Power
2026-03-31India reports 520.5 GW of installed generation capacity and continued national-grid expansionpositive0.25monitorPress Information Bureau / Ministry of Power
2026-03-23Indian Parliament addresses transformer and reactor supply constraintsnegative0.20monitorMinistry of Power, Government of India
2026-01-30Shilchar Technologies Limited reports financial results for FY2026 Q3uncertain0.71baseline_revision_candidateShilchar Q3 FY2026 unaudited financial results
2025-10-16Shilchar Technologies Limited reports financial results for FY2026 Q2uncertain0.71baseline_revision_candidateShilchar Q2 FY2026 unaudited financial results
2025-08-11Shilchar Technologies Limited reports financial results for FY2026 Q1uncertain0.71baseline_revision_candidateShilchar Q1 FY2026 unaudited financial results

Event paths are bounded monitoring scenarios. None of the listed market reactions is presented as proven causality.

14

Capital Allocation and Governance

Capital allocation

The model gives priority to balance-sheet capacity, reinvestment needs and cash conversion. Net cash is added in DCF, but only once; it is not also capitalized through the earnings multiple.

Expansion capex is explicitly deducted from FCFF in the year it is expected to be spent. A project can be strategically attractive and still reduce near-term free cash flow.

Governance stance

Reported actuals, research-cut dates, evidence hashes and approved ratings are outside the chatbot edit surface. Narrative and assumptions may change only through a validated, versioned patch.

Private contracts, complete customer rosters and undisclosed order economics remain unknown rather than estimated as facts.

Comparable-company screen

CompanyWhy includedHow used
Transformers and Rectifiers (India)Indian transformer manufacturing comparableOperating and capacity comparison; valuation excluded without a common frozen market-data cut
Voltamp TransformersDomestic transformer comparableMargin and product-positioning comparison
Bharat BijleeElectrical equipment comparableCycle and capital-intensity context
Hitachi Energy IndiaLarge power-grid equipment competitorIndustry capacity and technology context; scale is not directly comparable
15

Methodology, Sources and Disclosures

Evidence classes

Reported: official filing or exchange disclosure. Derived: deterministic calculation from reported figures. Forecast: model output using disclosed assumptions. Judgment: analyst interpretation. Scenario: bounded alternative, not a prediction.

Source ledger

SourceDateUseStatus
Shilchar Technologies Annual Report FY2025-262026-07-15Primary company and audited financial evidenceavailable
FY2026 audited financial results2026-05-05Primary financial statementsavailable
FY2026 results call transcript2026-05-11Management guidance and operating assumptionsavailable
Shilchar investor desk2026-07-30Official disclosure indexavailable
Argus verified Shilchar company-twin release2026-07-30Evidence-backed operating relationships, drivers and eventsavailable
Argus point-in-time statistical forecast run2026-07-30Forecast control and backtest recordavailable
Private customer contracts and complete supplier rosterKnown data gapknown_gap

Forecast governance

The point-in-time statistical baseline is frozen before event scenarios. Annual estimates use an explicit revenue-to-margin-to-EPS bridge. Events do not change the control forecast automatically; they create reviewable low/high deltas and require promotion into a new immutable version.

Limitations

  • Backtest histories are short and do not support strong claims of future accuracy.
  • Public disclosures do not reveal every customer, supplier, contract term or product-level margin.
  • Provider and extracted data are supporting evidence; official documents take precedence.
  • Valuation is sensitive to terminal growth, discount rates, multiples and the timing of operational assumptions.