Investment View
12 Aug 2026 close · [MP]
No approved target
Scenario midpoint
17:00 IST
Contracted infrastructure, visible projects, selective commodity torque.
Pembina's contracted pipeline and facilities base supports cash-flow durability; RFS IV adds near-term capacity while Cedar LNG and Greenlight define the next growth leg. Marketing exposure, construction timing and capital intensity keep the evidence from supporting a formal target today. [E1] [E2] [E3] [E4] [MP] [E5] [E6]
What must go right
Operating drivers must convert into cash within the timing and cost constraints shown in the digital twin.
What is priced imperfectly
The market can observe headline growth; the report concentrates on conversion, accounting basis and capital intensity.
Why no rating
The verified evidence does not include an approved annual schedule and valuation assembly. Sensitivities are shown without promotion to a target.
Investment Summary
Pembina's contracted pipeline and facilities base supports cash-flow durability; RFS IV adds near-term capacity while Cedar LNG and Greenlight define the next growth leg. Marketing exposure, construction timing and capital intensity keep the evidence from supporting a formal target today.
| Q2 CAD m | 2025 | 2026 | YoY |
|---|---|---|---|
| Revenue | 1,792 | 2,152 | +20% |
| Net revenue | 1,184 | 1,322 | +12% |
| Gross profit | 780 | 933 | +20% |
| Adjusted EBITDA | 1,013 | 1,064 | +5% |
| Earnings | 417 | 512 | +23% |
| Adjusted CFO | 698 | 778 | +11% |
| Capex | 197 | 218 | +11% |
Direct labels make the scale visible; the table preserves exact accounting labels. [E1]
Contracted Midstream Thesis
Base case
Contracted infrastructure, visible projects, selective commodity torque. The scenario respects the timing of the company's disclosed volume, capacity, commodity, customer or project route.
Variant case
Upside requires better conversion without proportionate cost, capital or dilution. Downside is an economic failure in the relevant company-specific driver—not just a slower headline KPI.
| Driver | Economic mechanism |
|---|---|
| Take-or-pay | Stabilizes pipeline revenue against physical throughput |
| Fractionation capacity | RFS IV adds 55,000 bpd at Redwater |
| Commodity prices | Move Marketing & New Ventures margins |
| CAD/USD | Moves translated U.S.-linked cash flows |
Falsification: the thesis weakens if the leading driver improves while normalized earnings and cash conversion deteriorate outside a clearly bounded build or commissioning cycle. [E1] [E2]
Digital Twin and Asset System
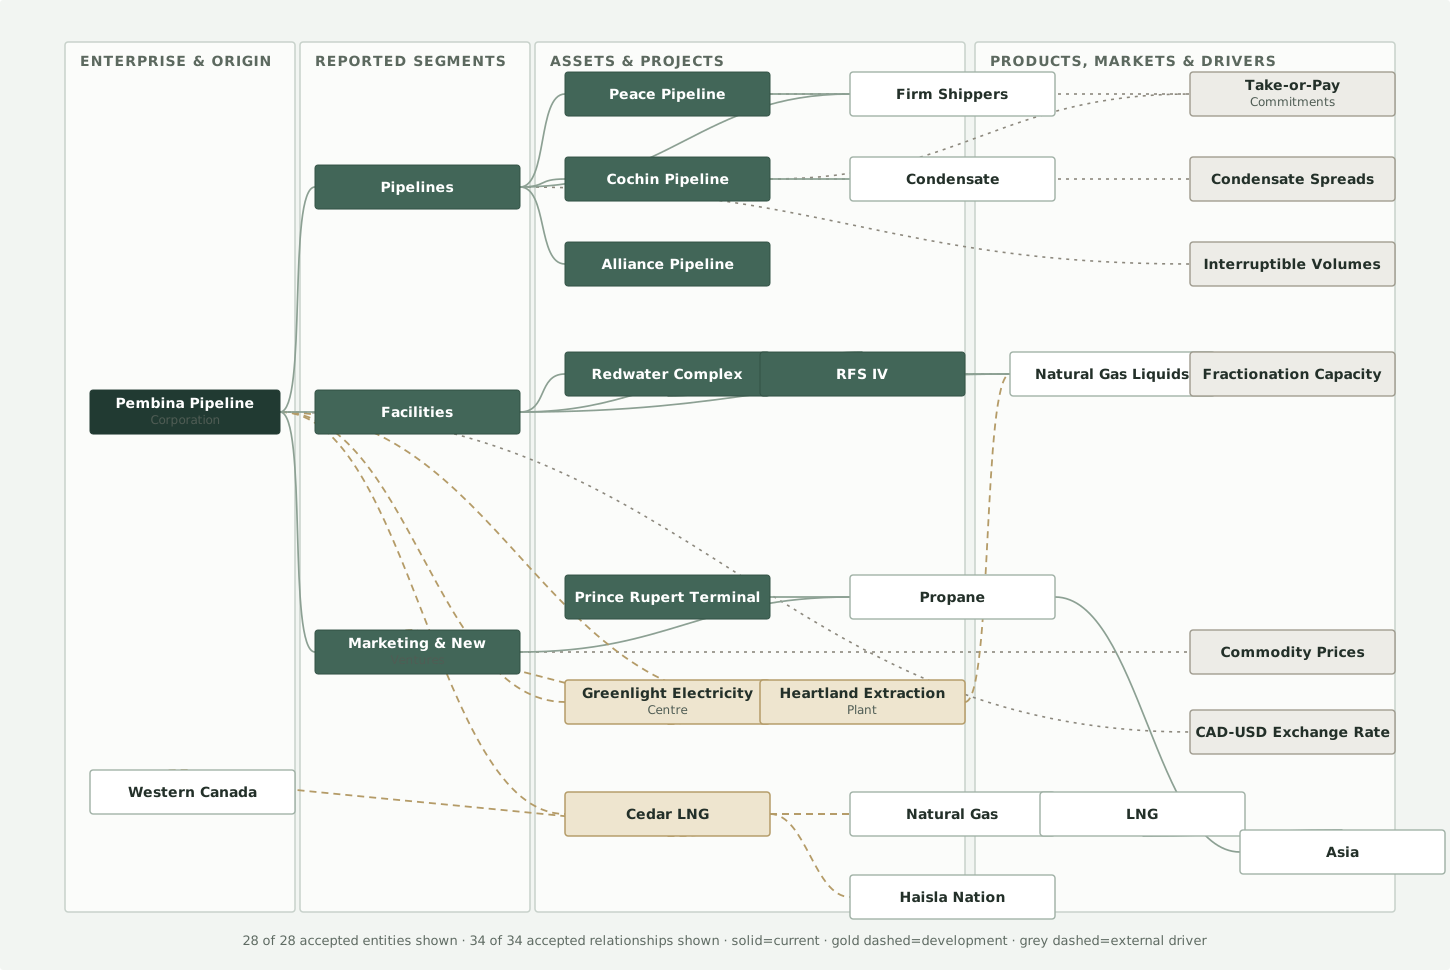
The twin connects the reported segments to operating assets, products, markets, counterparties, development projects and external drivers. It shows all accepted graph entities and relationships available at the evidence cut; relationship lines describe evidence, not relative financial weight.
| Source entity | Relationship | Target | Evidence |
|---|---|---|---|
| Peace Pipeline | Contracted | Take-or-pay commitments | [E5] |
| RFS IV | Adds capacity | Fractionation capacity | [E1] |
| Cochin | Driven by | Condensate spreads | [E1] |
| Cedar LNG | Strategic partner | Haisla Nation | [E2] |
| Propane | Sold into | Asia | [E2] |
Representative financially decisive links; full topology appears above.
Pipelines and Take-or-Pay
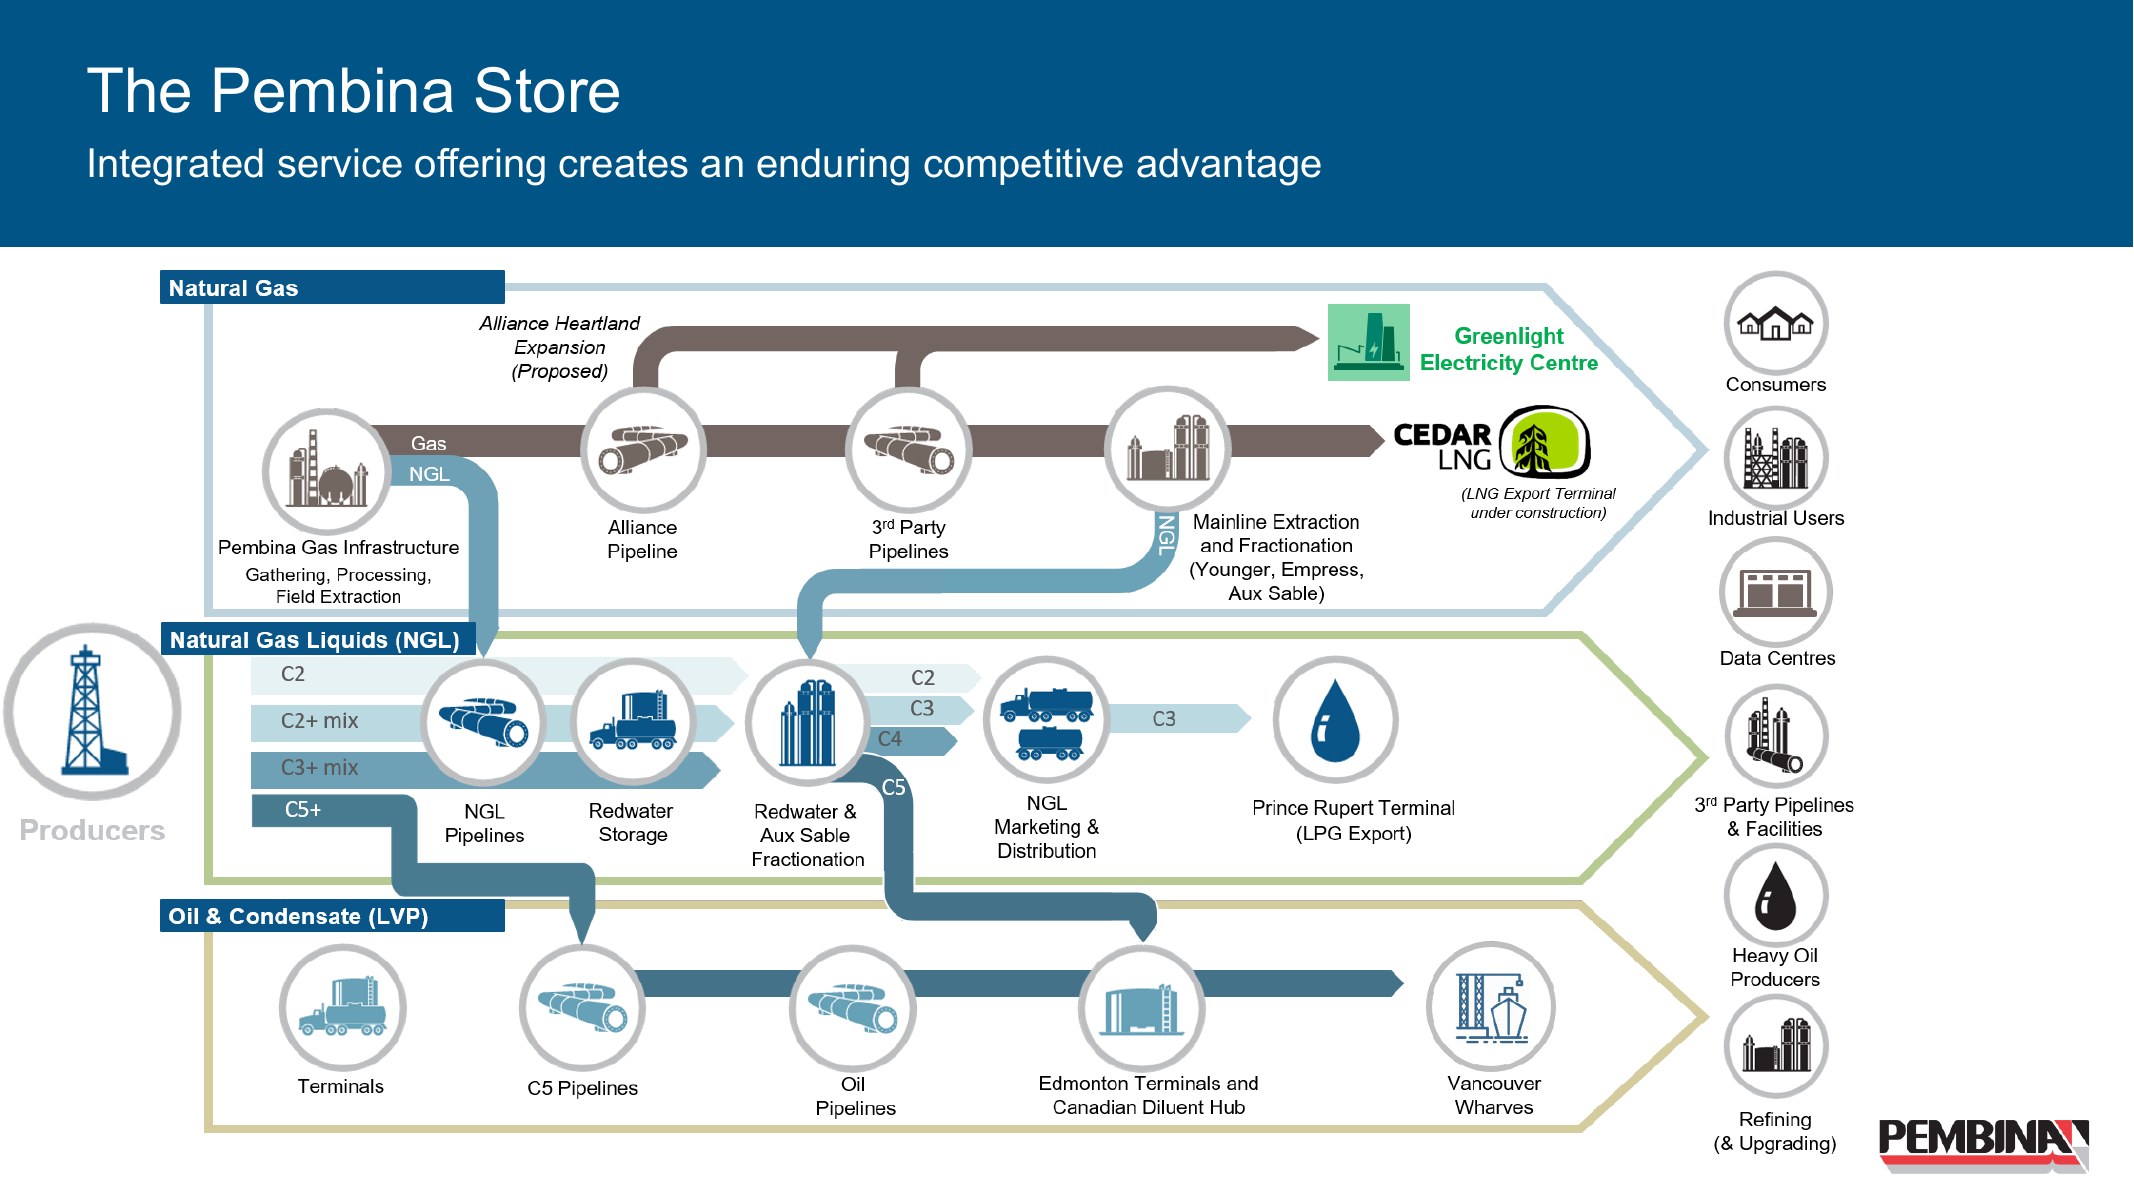
Pipelines combines Peace, Alliance and Cochin. Take-or-pay contracts support the base, while interruptible throughput supplies operating leverage. Peace contracted roughly 110,000 bpd of renewed or incremental capacity; Cochin's H2 comparison is softer because some firm shippers advanced take-or-pay volumes. [E1] [E2]
| Route | Current evidence | Investment read-through |
|---|---|---|
| Peace Pipeline | ~110,000 bpd renewed or incremental contracts | Supports utilization and cash-flow durability |
| Cochin | Firm commitments plus condensate-spread-sensitive throughput | Contracted base with variable upside |
| Alliance | Q3 lower / Q4 higher seasonality | Quarterly timing, not structural demand |
| Firm shippers | Take-or-pay commitments | Reduces physical-volume uncertainty |
Contract coverage protects the base; interruptible throughput and toll realization determine the incremental earnings slope.
Facilities and Fractionation
Facilities processes, fractionates and stores NGLs. RFS IV entered service in late May on time and under budget, adding 55,000 bpd of propane-plus fractionation capacity at Redwater; a full quarter is the clearest Q3 volume bridge. [E1]
| Operating KPI | Current value | Analytical use |
|---|---|---|
| RFS IV capacity | +55,000 bpd | In service late May |
| Total fractionation | ~256,000 bpd | Post-RFS IV |
| Facilities Q2 adjusted EBITDA | C$386m | Versus C$331m |
| Heartland | Late-2029 target | No Q3 contribution |
The bridge separates installed capacity, utilized volume and recognized earnings. No chart attribute claims the Q2 EBITDA increase came solely from RFS IV.
Marketing and Commodity Exposure
Marketing & New Ventures carries the variable earnings exposure. Frac spreads represented about two-thirds of 2025–26 marketing contribution; Q3 coverage was about 90% and Q4 about 40%. Track realized marketing margin, hedge coverage, physical volumes and condensate spreads—not mining cost measures. [E1]
| Variable | Observation | Forecast consequence |
|---|---|---|
| Frac-spread mix | ~2/3 of 2025–26 marketing contribution | Material source of EBITDA variability |
| Q3 hedge coverage | ~90% | Near-term spread exposure is substantially bounded |
| Q4 hedge coverage | ~40% | Greater upside and downside participation |
| Cochin condensate spreads | H2 throughput above commitments is correlated | Physical volume and marketing sensitivity can interact |
These indicators are monitoring inputs, not a commodity-price forecast or a statistical hedge model.
Projects and Market Access
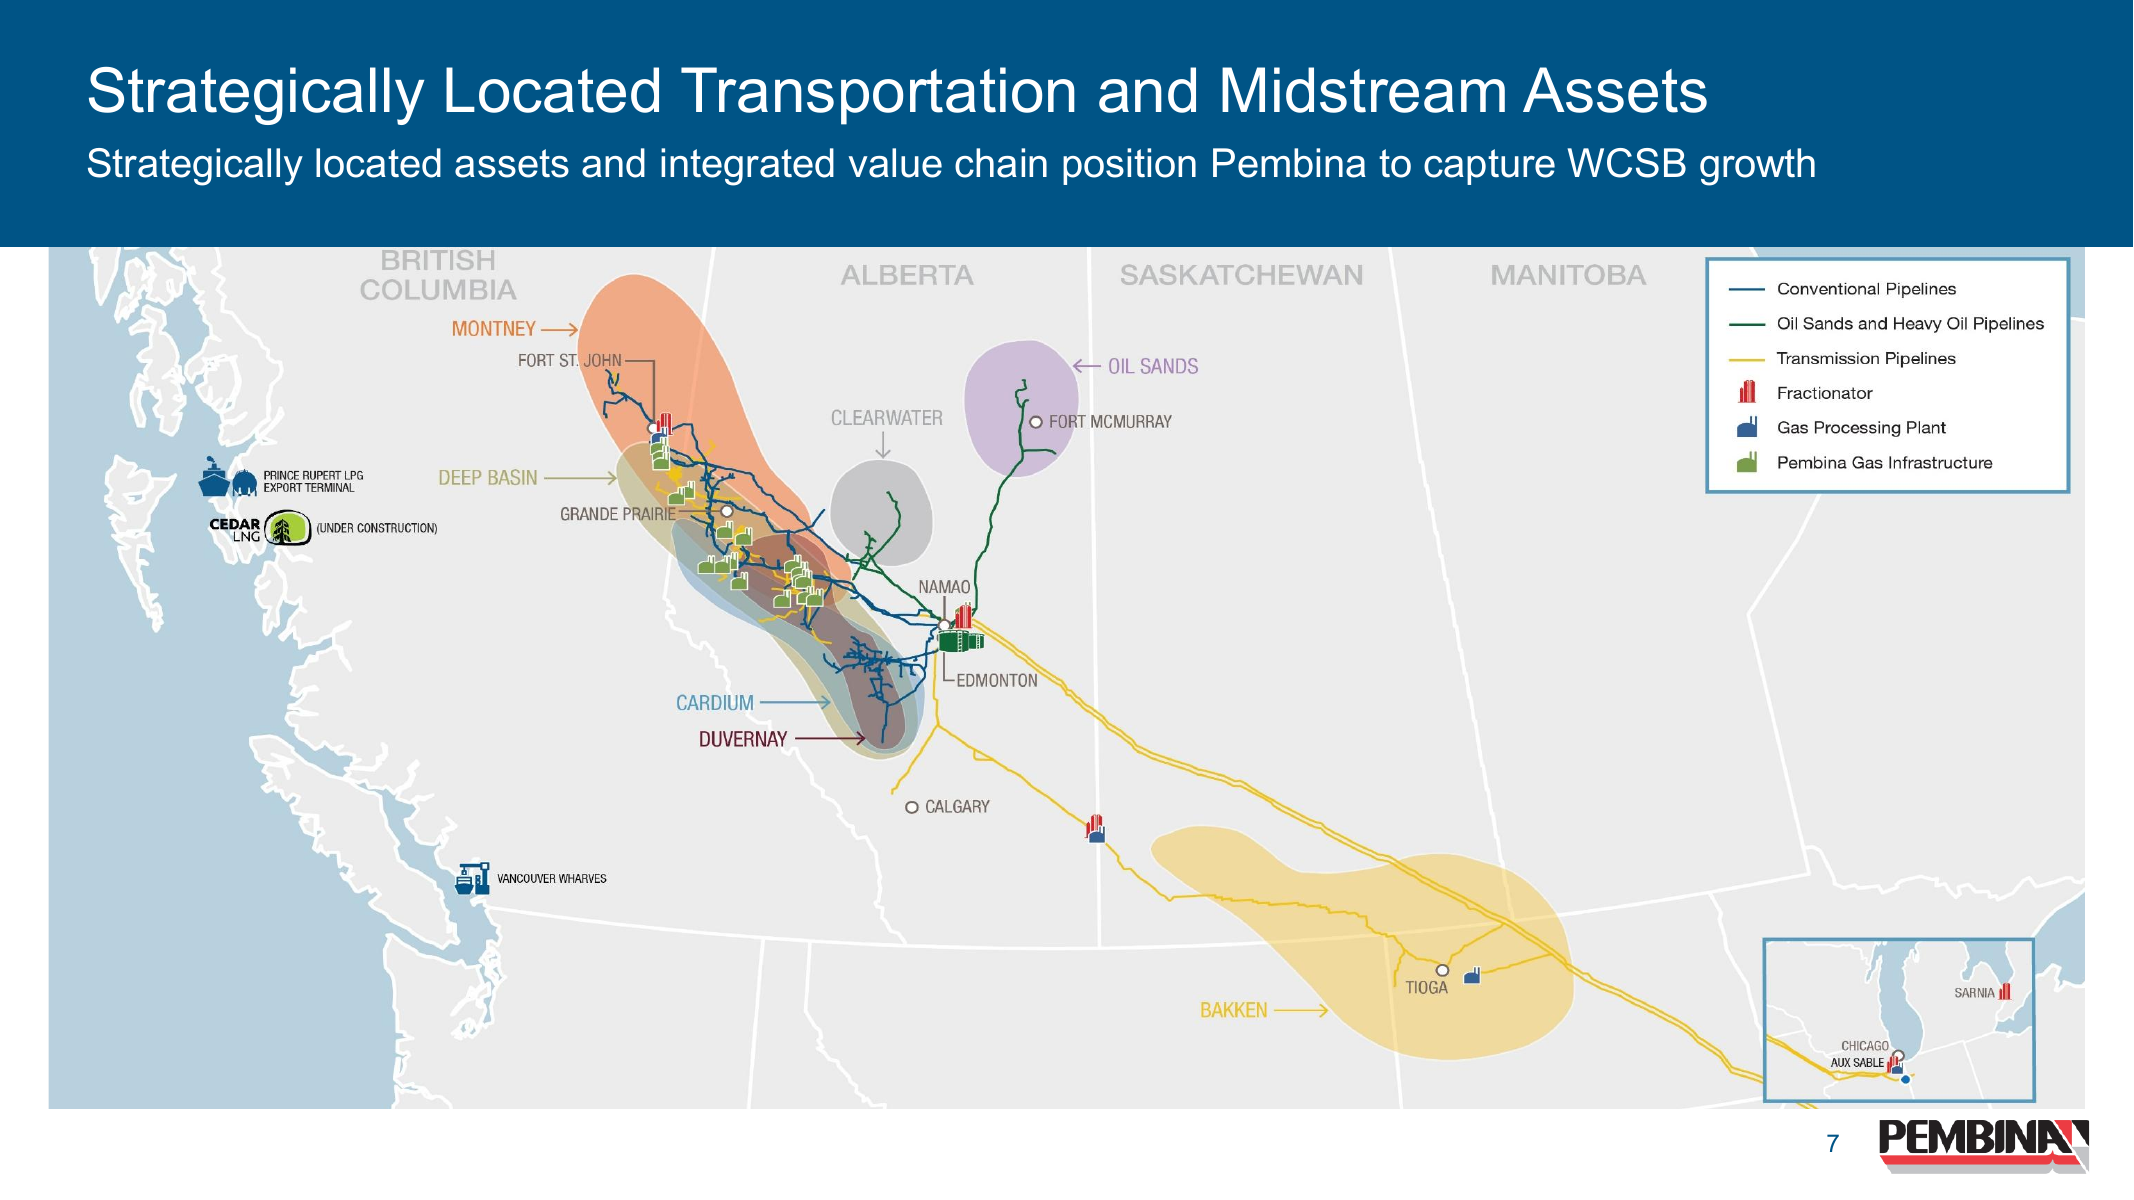
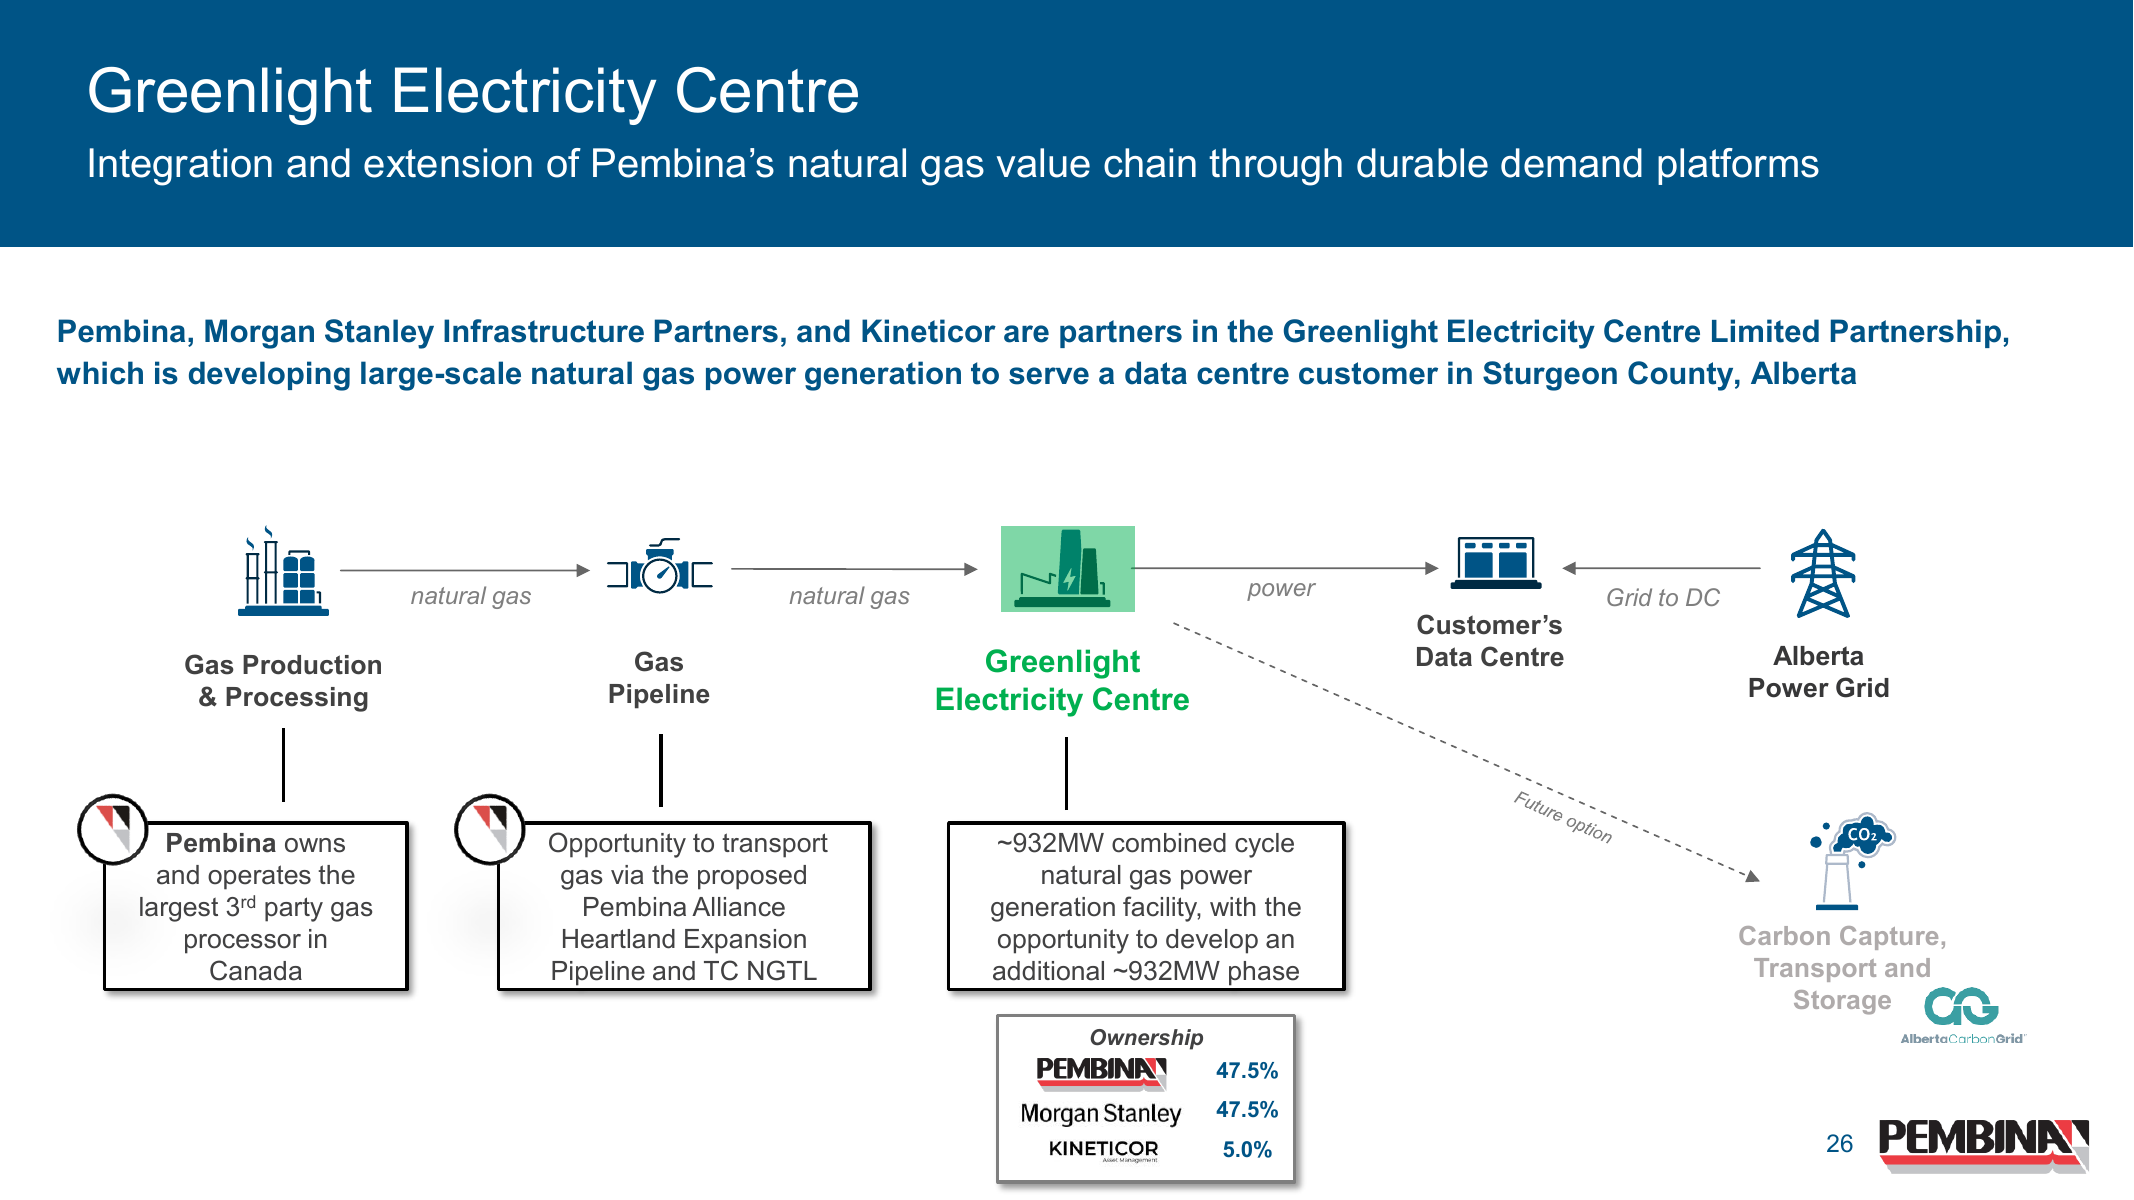
Cedar LNG is fully contracted and targets first exports in late 2028. Greenlight is a 932 MW project underpinned by a 20-year Meta agreement in the issuer deck; anticipated in-service is H2 2030, with approximately C$2.1bn net Pembina investment and approximately C$310m net annual run-rate adjusted EBITDA when operational. These are construction and commissioning routes, not current-quarter revenue. [E1] [E2] [E3]
| Project | Scale / contract | Next gate | Treatment |
|---|---|---|---|
| RFS IV | +55,000 bpd | Full-quarter utilization | Current base |
| Greenlight | 932 MW; 20-year Meta; C$2.1bn net investment; ~C$310m annual adj. EBITDA | H2 2030 in service | Monitor; no Q3 revenue |
| Cedar LNG | 3.3 mtpa; fully contracted | Vessel delivery; late-2028 exports | Monitor; no Q3 revenue |
| Heartland | C$570m sanctioned plant | Late-2029 in service | Monitor; no Q3 revenue |
Financial Record and Accounting
The latest issuer release is the protected actual. GAAP and adjusted measures remain separately labelled; the report does not blend stale provider definitions into the current quarter.
| Measure | Current value | Basis |
|---|---|---|
| GAAP earnings | C$512m | Q2 standalone |
| GAAP diluted EPS | C$0.82 | Q2 standalone |
| Adjusted earnings | C$415m | Issuer non-GAAP |
| Adjusted basic EPS | C$0.66 | Issuer non-GAAP |
| GAAP CFO | C$897m | Q2 standalone |
| Capex | C$218m | Q2 standalone |
No silent averaging: basic and diluted shares, GAAP and non-GAAP definitions, and standalone-quarter versus year-to-date periods remain distinct.
Forecast Method
This is a reproducible quarterly sensitivity, not a completed bottom-up annual digital-twin forecast. Source-backed actuals and analyst assumptions are visually separated.
| Control | Treatment |
|---|---|
| Latest actual | Q2 issuer filing / earnings release |
| Base revenue bridge | Q2 × 0.999442 seasonality + C$15m RFS IV |
| Scenario revenue bounds | Base × 92% / 100% / 108% |
| Case net margins | 15.46% / 18.97% / 21.95% |
| Diluted shares | 582m analyst control |
| Events | Monitor or bounded scenario; no causal event adjustment |
| Approval | Analyst review required |
Q3 Forecast and Scenarios
| Scenario | Reconciled operating route | Net margin | Diluted shares |
|---|---|---|---|
| Downside | Base × 92% = C$1.9925bn; C$173.3m total stress includes no RFS IV and softer interruptible/marketing | 15.46% | 582m |
| Base | Q2 × seasonality + C$15m RFS IV = C$2.1658bn | 18.97% | 582m |
| Upside | Base × 108% = C$2.3391bn; C$173.3m total uplift includes C$30m capacity/marketing and wider demand/volume upside | 21.95% | 582m |
Forecast status: frozen for discussion and analyst-review-required. Bounds are sensitivities, not confidence intervals, probabilities or consensus ranges.
Capital Allocation
Cash conversion is assessed after recognizing the capital required to sustain and expand the network. Current evidence supports a quarterly cash view, not a complete leverage or multi-year funding schedule.
| Capital route | Current evidence | Investment interpretation |
|---|---|---|
| GAAP CFO | C$897m Q2 standalone | Primary cash anchor |
| Adjusted CFO | C$778m issuer non-GAAP | Retain reconciliation; do not substitute for GAAP |
| Capex | C$218m Q2 standalone | Current investment |
| NCIB | Authorization renewed | No repurchase execution assumed |
| Cedar / Greenlight / Heartland | Long-dated development capital | No Q3 revenue or cash contribution assumed |
A verified cash, debt, dividend and maintenance-versus-growth capex schedule is required before making a leverage or distributable-cash claim.
Valuation Framework
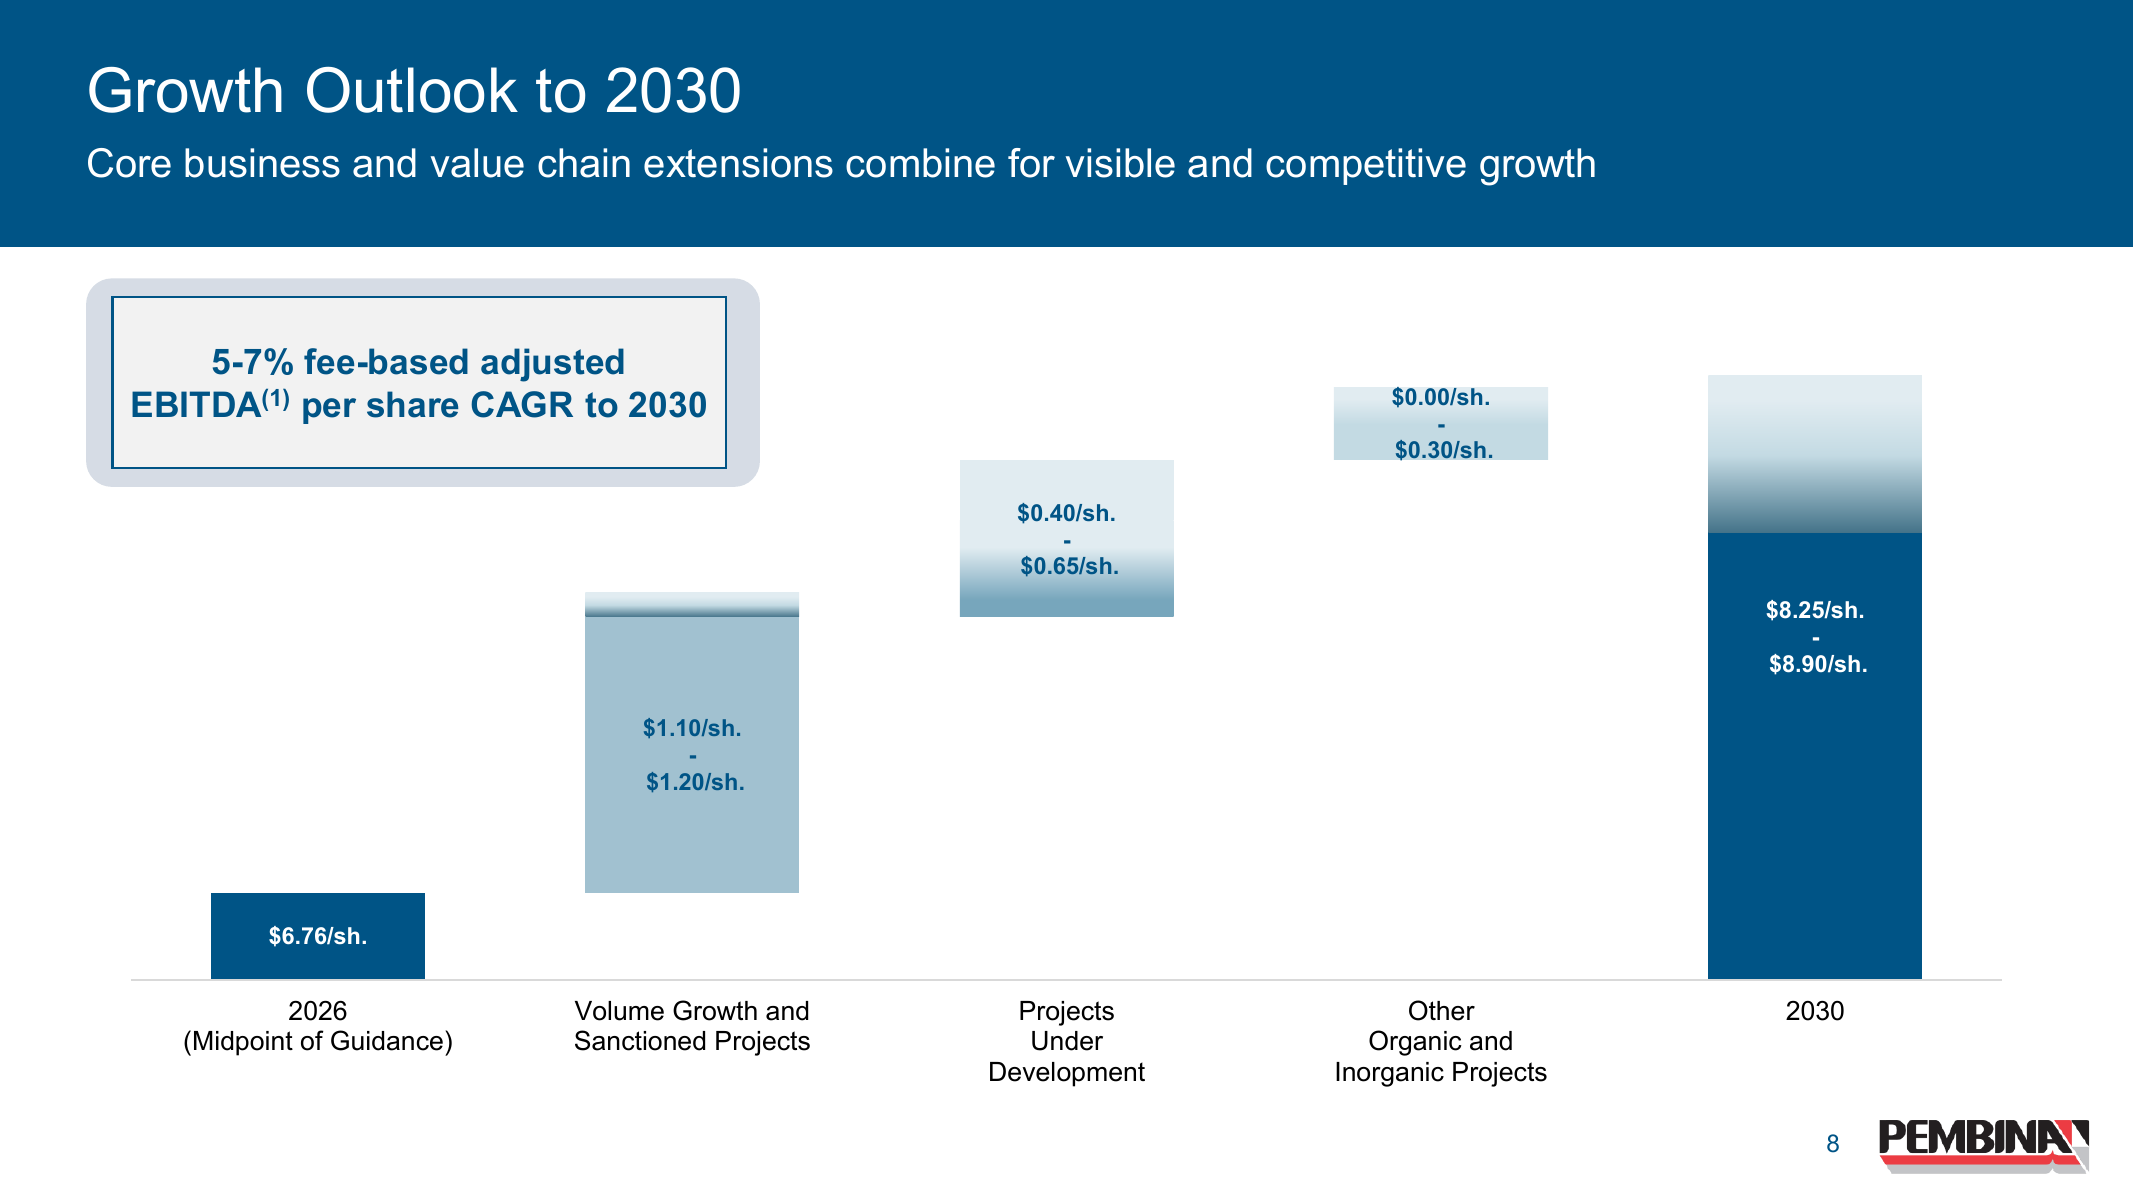
The issuer's C$4.35–4.55bn 2026 adjusted EBITDA guidance provides an operating anchor, not an equity value. A target is withheld until the enterprise-to-equity bridge and annual schedule are verified. [E1]
| Valuation gate | Available evidence | Status |
|---|---|---|
| Forward adjusted EBITDA | 2026 guidance C$4.35–4.55bn | Available operating anchor |
| Enterprise-to-equity bridge | Net debt, NCI and other claims | Required |
| Comparable multiple set | Dated peer and history evidence | Required |
| Project FCFF | Capex, D&A, tax and working capital schedule | Incomplete |
| Dividend path | Payout, growth and cost of equity | Required |
| Role | Method | Evidence requirement |
|---|---|---|
| Primary | Forward EV / adjusted EBITDA | Requires verified net debt, NCI and peer multiple |
| Cross-check | Project-aware FCFF DCF | Requires project capex, D&A, tax and working capital schedules |
| Supplemental | Dividend discount | Requires verified dividend path and cost of equity |
The issuer growth objective is not an equity valuation. No implied value, return, target price or rating is presented.
Risks and Catalysts
Risks and catalysts are routed through an exposed asset or segment, an accounting line and an observable evidence threshold before they enter a scenario. Observed event-window returns are not treated as causal evidence.
| Monitoring gate | Current status | What changes the model |
|---|---|---|
| RFS IV utilization | In service | Sustained throughput and segment contribution |
| Frac spreads / hedges | Q3 ~90%; Q4 ~40% | Realized margin and new hedge book |
| Cedar LNG | Late-2028 export target | Delivery, commissioning and contract start |
| Greenlight | FID; 20-year Meta agreement; H2 2030 target; C$2.1bn net investment | Construction, funding and in-service evidence |
| Heartland | Sanctioned; late-2029 target | Construction and commissioning |
| NCIB | Authorized | Only executed repurchases change shares |
Sources, Methods and Disclosures
SEC filings and issuer financial materials are the source of record for current actuals. Market data are supporting observations. Forward scenarios, formulas and valuation sensitivities are analyst calculations.
| ID | Source | Published / snapshot | Link |
|---|---|---|---|
| E1 | Q2 2026 results | 2026-07-31 | Open · www.sec.gov |
| E2 | August 2026 corporate update | 2026-08-13 | Open · www.pembina.com |
| E3 | Greenlight FID | 2026-07-02 | Open · www.sec.gov |
| E4 | Heartland sanction | 2026-05-26 | Open · www.sec.gov |
| MP | PPL.TO historical market price | 2026-08-12 | Open · finance.yahoo.com |
| E5 | Q1 2026 results | 2026-05-08 | Open · www.sec.gov |
| E6 | Normal course issuer bid renewal | 2026-05-14 | Open · www.sec.gov |
Key limitations
- The Q3 control is frozen but remains analyst-review-required.
- No approved annual schedule or valuation assembly was available at the evidence cut.
- Issuer visuals are credited at point of use; analytical charts and the digital-twin rendering are report-created.
- Provider actuals that conflict with current issuer definitions are not blended into reported results.
- This report is information for discussion, not investment advice or an offer to transact.
Forecasts, scenarios and valuations are uncertain and may differ materially from actual outcomes. Investors should independently assess suitability, liquidity, taxes and risk.