AI infrastructure leadership meets the duration test
NASDAQ: NVDA22 July 2026USD
Model indication
Reference price$207.29
21 July 2026 close
Base value$285
12-month model indication
Implied upside36.7%
price return; no dividend assumed
StatusOutperform
human analyst approval required
Our base case values NVIDIA at $285 per share. The model indication is driven by FY2028 adjusted EPS of $12.76 and a 22.0x through-cycle multiple, plus net cash. The recommendation label is provisional until a responsible analyst approves the assumptions, disclosures and suitability for the intended audience.
Market price and peer data are provider cross-checks; valuation is our calculation. FMP supporting market data
Core variant view
The model's FY2027 Q2 Revenue estimate of $91.93bn is only 0.1% from current consensus. The larger difference is adjusted EPS: $2.23 versus consensus of $2.08, a 7.3% premium.
This is therefore not a call that the market has missed near-term demand. It is a call that rack-scale mix, networking attach and operating leverage can sustain earnings conversion while growth normalizes.
Does AI infrastructure spending remain productive enough for customers to sustain multi-year capex?
Can Rubin ship at rack scale without a material transition delay or margin penalty?
Does networking and software content offset accelerator price normalization?
How much of China demand remains economically and legally addressable?
What is the right normalized multiple once Revenue growth falls below 25%?
Research cut and scope
This is a fixed-cut initiation report using information available by 22 July 2026, 14:22 UTC. FY2027 Q1 is the latest reported quarter. FY2027 Q2 remains a forecast period.
The report separates reported facts, calculations, forecast assumptions, analyst judgments, scenarios and known unknowns. It is internal research, not investment advice or a published broker recommendation.
A premium valuation can work only if rack-scale platform economics persist after the current supply-constrained phase.
Investment case in one page
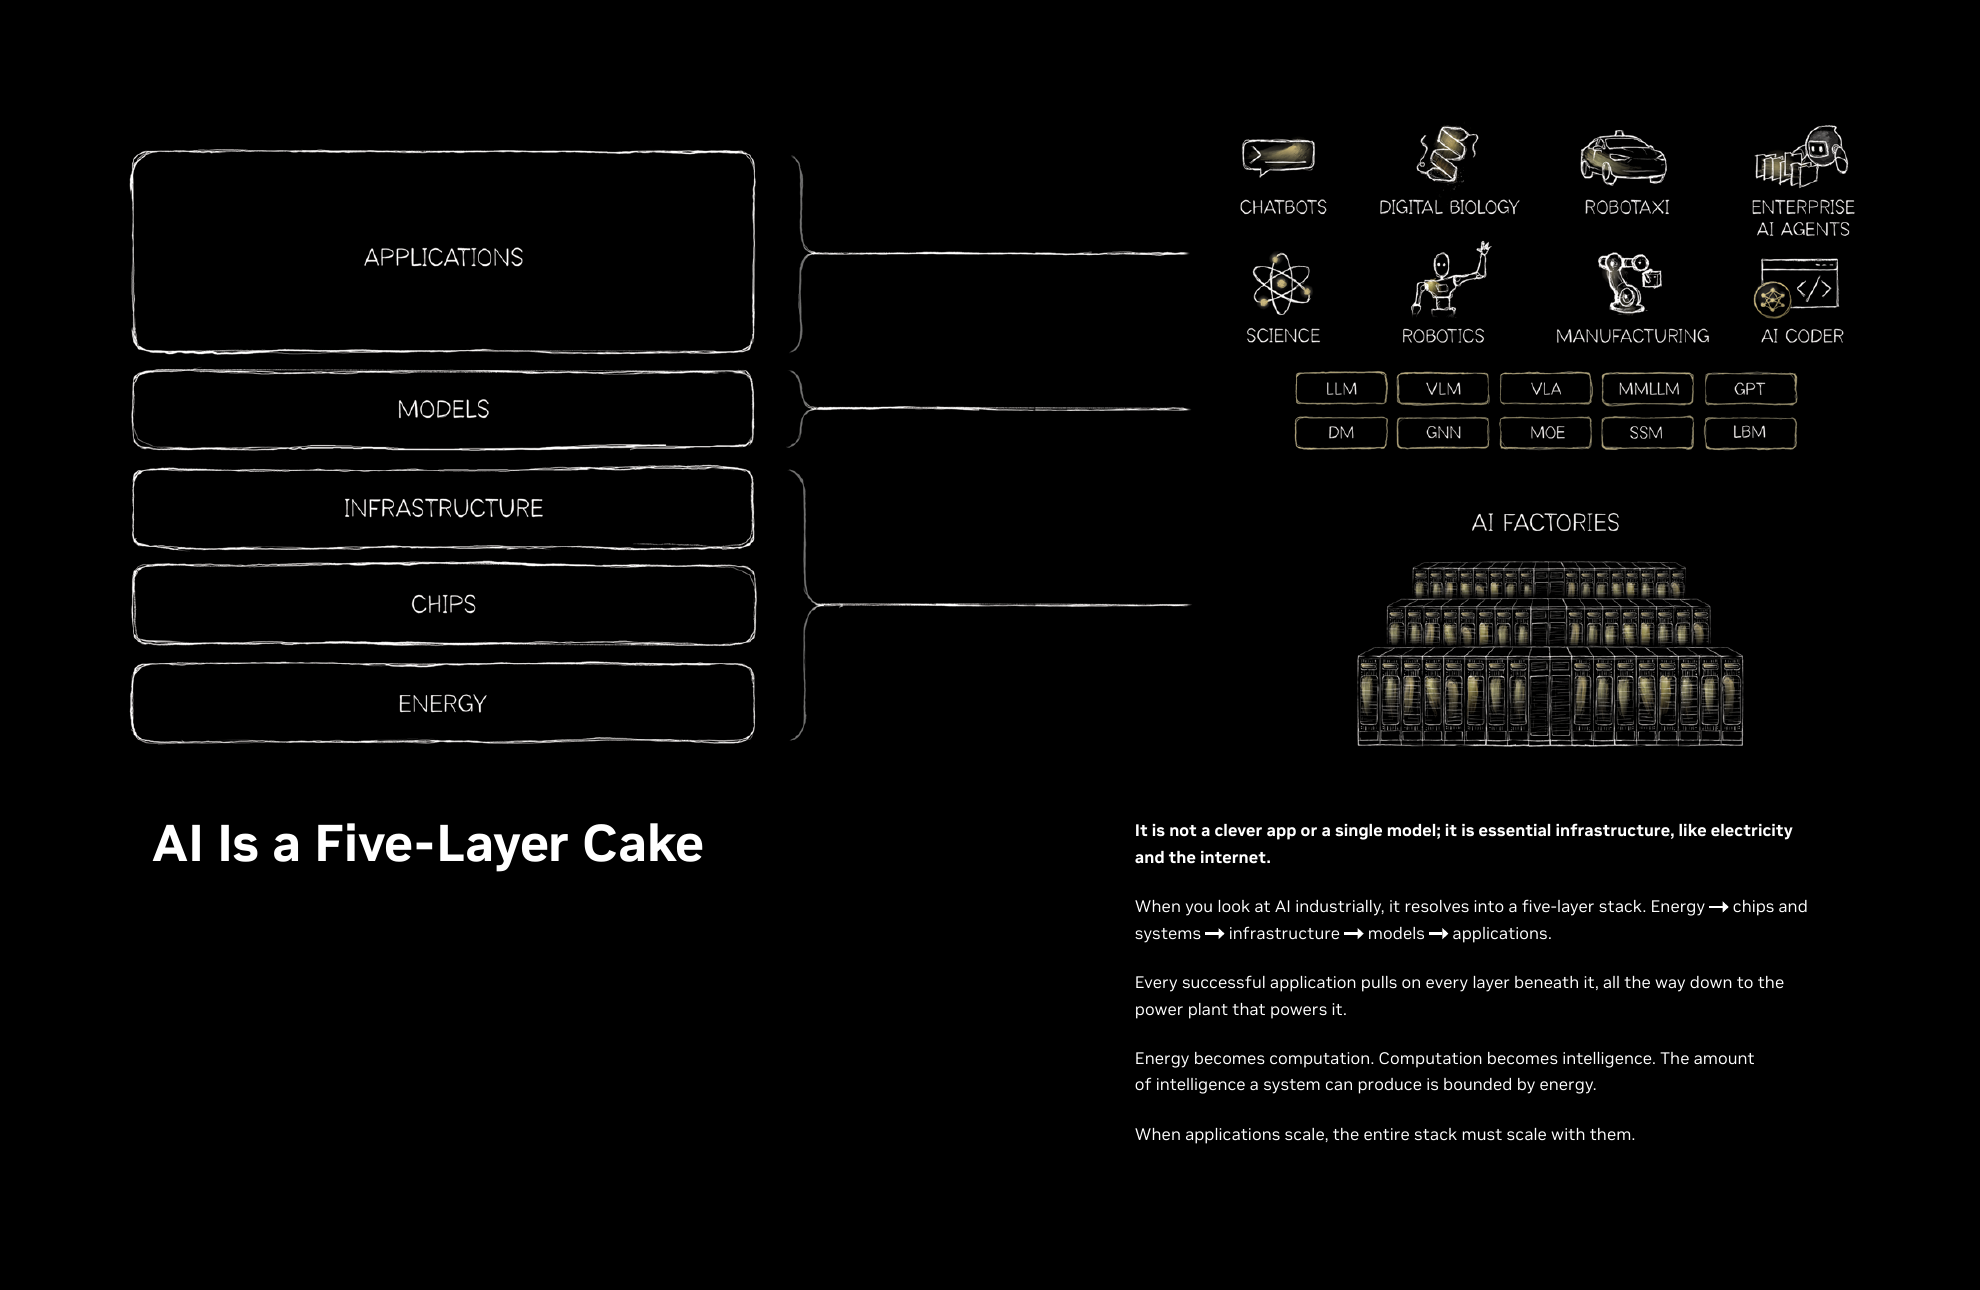
NVIDIA sits at the control point of accelerated computing: GPU compute, interconnect, networking, systems software and a developer ecosystem are designed together. That integration raises customer switching costs and lets the company capture more content per AI factory than a stand-alone chip vendor.
The base case assumes the current buildout broadens from hyperscaler training clusters into inference, AI clouds, enterprise, sovereign systems and physical AI. We do not extrapolate the FY2024-FY2026 growth rate indefinitely: Revenue growth fades from 82% in FY2027 to 15% by FY2031, while adjusted gross margin declines from roughly 75% to 73.5%.
At the reference price, valuation already discounts substantial success. Upside requires execution through Rubin and durable earnings conversion; the main downside is not a single competitor, but a combined demand digestion, product-transition and multiple-compression event.
FY2027 Q1 is reported; subsequent periods are analyst estimates. FY2027 Q1 results
Asymmetric payoff
The wide range is intentional. NVIDIA combines unusually high earnings power with a valuation whose duration is sensitive to customer returns, architecture transitions and the terminal multiple. The bear case is modestly below spot; the bull case requires both superior earnings and a premium multiple.
03
Investment Thesis and Variant View
The model is close to Revenue consensus; the investable variant is operating leverage, platform durability and the value assigned to normalized growth.
Where we differ from current consensus
FY2027 Q2
Our model
Current consensus
Difference
Revenue
$91.93bn
$91.81bn
0.1%
Adjusted EPS
$2.23
$2.08
7.3%
Revenue is not a material variant at this horizon. The EPS premium comes from our explicit gross-margin, operating-expense, tax and share-count bridge. Current consensus is a point-in-time context source, not a backtest benchmark because a complete historical consensus archive is unavailable.
stronger platform breadth and durable scarcity value
What the current price appears to require
At $207.29, NVIDIA trades at roughly 31.6x trailing earnings and 19.8x trailing enterprise value to Revenue in the supporting market snapshot. The market price is below our base value but already assumes continued category leadership and a long duration of exceptional cash generation.
A credible long thesis therefore requires more than 'AI grows.' It requires that customers earn acceptable returns on AI infrastructure, that NVIDIA retains a broad platform content advantage, and that normalized margins remain structurally above pre-AI-cycle levels.
AI factory economicsthroughput, utilization and cost per token
The commercial logic is cross-layer optimization. Better performance at one component matters less than usable throughput, deployment time, power efficiency and developer compatibility across the full system.
Data Center, Gaming, Professional Visualization, Automotive, OEM & Other
Historical demand mix
FY2027 framework
Data Center and Edge; Data Center split into Hyperscale and ACIE
Forward demand and customer broadening
Products
Compute, networking, systems and software
Driver and competitive analysis
These taxonomies must not be mixed. Data Center is an end-market disclosure, not the same accounting level as Compute & Networking; historical categories are retained with validity dates rather than presented as current segments.
Model capability and application adoption→Token demand and utilization→Customer returns and capex budgets→Power and data-center commissioning→Rack orders→NVIDIA Revenue, margin and EPS
The chain prevents a common analytical error: treating every AI announcement as immediate semiconductor Revenue. An event becomes financially material only after it changes a funded deployment, timing, system content, utilization or price/cost assumption.
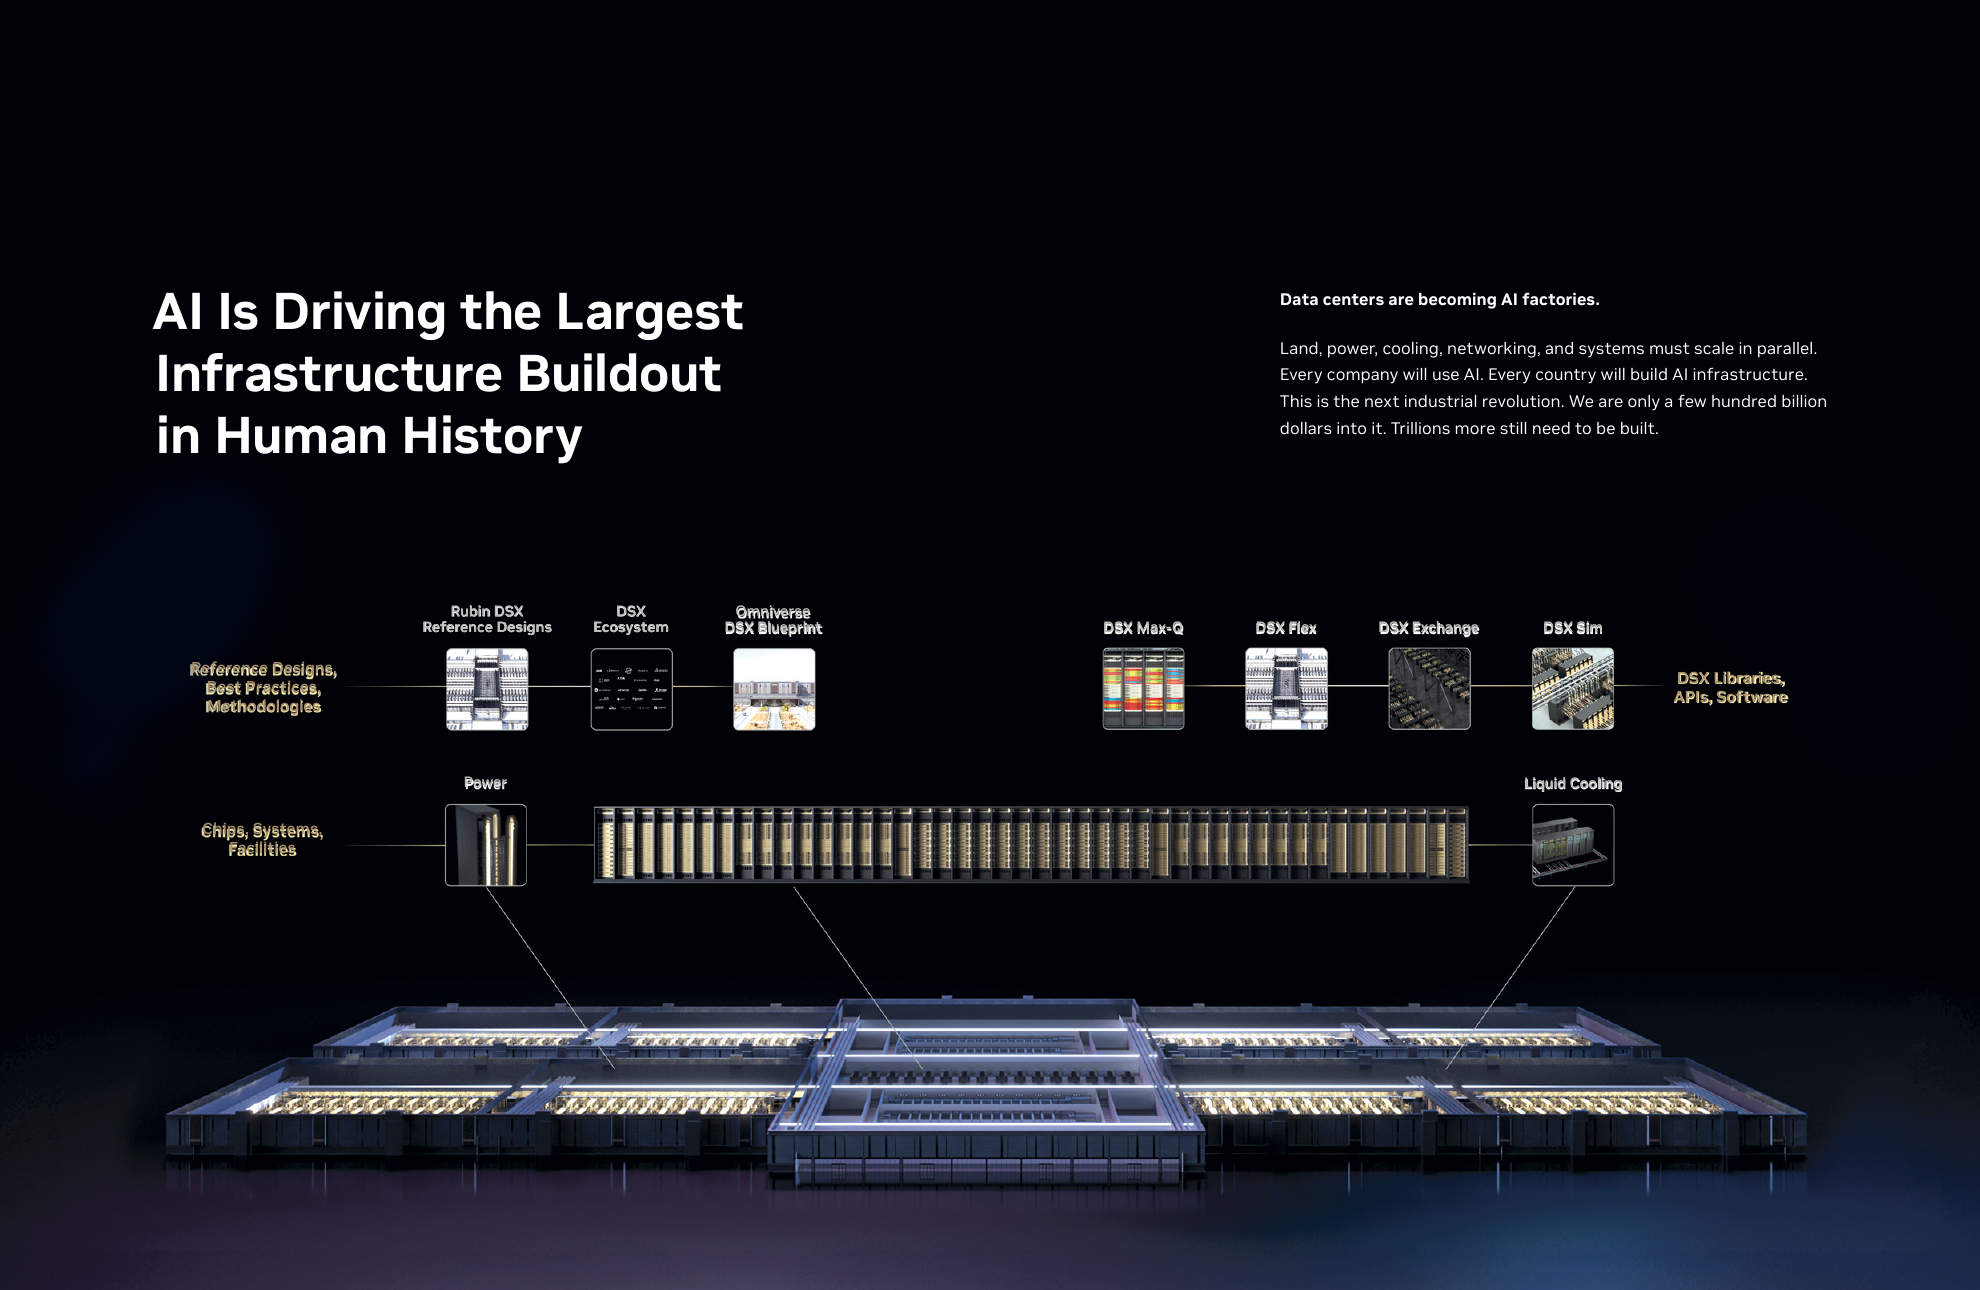
In a supply-constrained phase, foundry wafers, HBM and advanced packaging determine shipments. As component supply improves, the limiting factor can shift to rack integration, power, cooling, permitting, data-center completion, customer financing or application utilization.
Our forecast therefore does not use a single semiconductor TAM multiplier. It monitors the bottleneck that is currently closest to installed Revenue and revises timing before changing the long-run demand thesis.
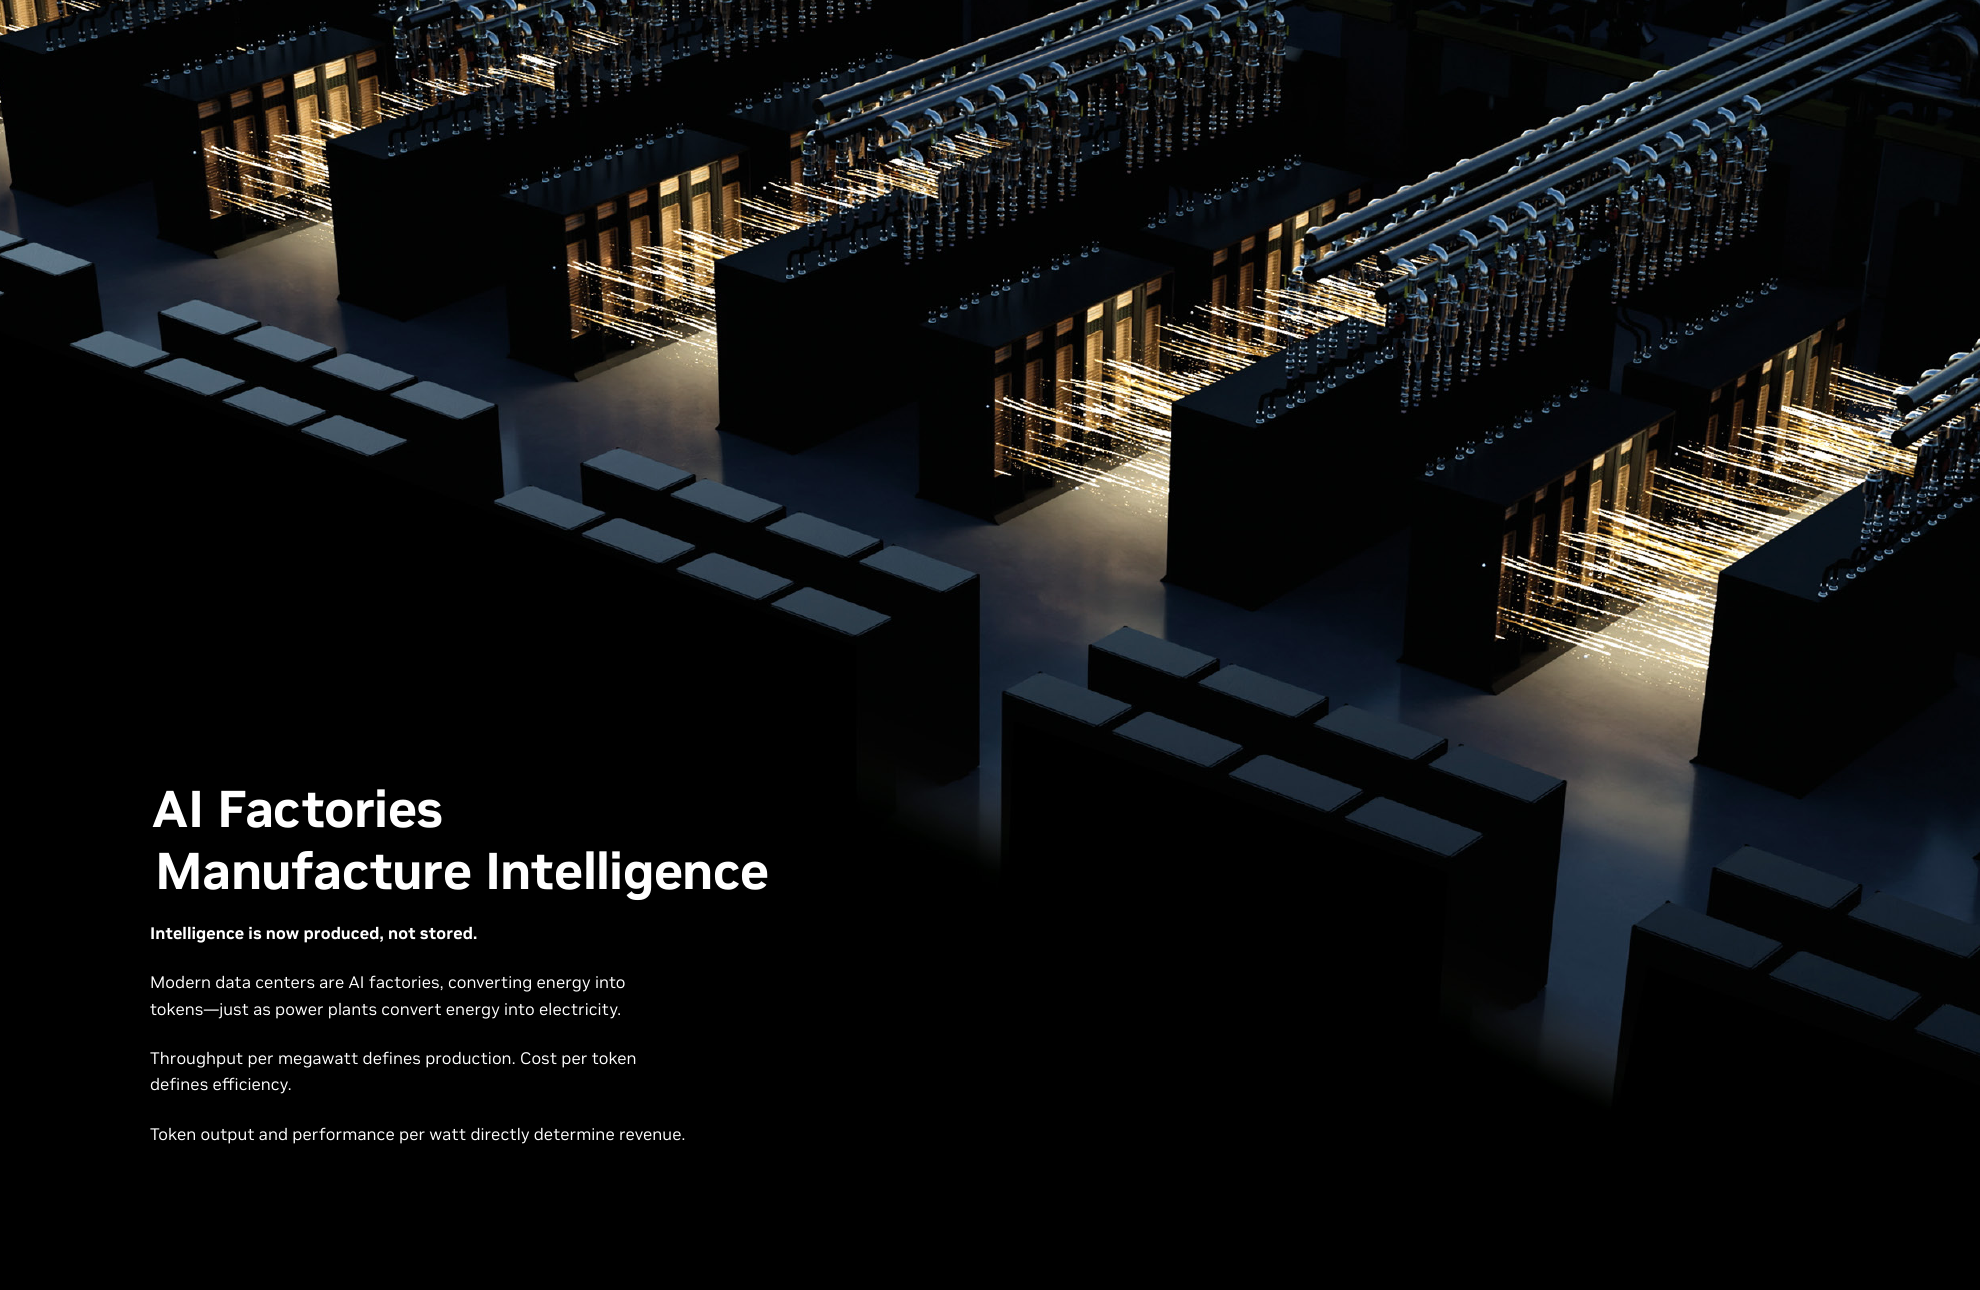
The customer buys economically useful output, not only chip specifications. If a new system increases useful throughput per megawatt and reduces cost per token, it can support both replacement demand and a higher NVIDIA content share even when unit pricing is high.
The analytical counterweight is transition cost: new architectures can temporarily raise inventory, expedite fees, warranty exposure, qualification time and gross-margin volatility.
Hyperscalers anchor demand, while sovereign, enterprise and industrial deployments determine whether concentration falls over time.
Customer concentration is economically important
Largest direct customer21%
FY2027 Q1 Revenue
Second17%
FY2027 Q1 Revenue
Third16%
FY2027 Q1 Revenue
Hyperscalersabout 50%
of Q1 Data Center Revenue
The direct-customer percentages do not identify ultimate end users and may include distributors, cloud providers or system builders. They show that timing or procurement changes at a few counterparties can move quarterly Revenue even when end demand remains broad.
Hyperscalers funded the first large phase of generative-AI infrastructure. A longer growth runway requires repeat demand from those customers and incremental deployments in AI clouds, enterprise, government, industrial and scientific markets.
We would regard a rising ACIE contribution, more named production deployments and lower dependence on the top three direct customers as stronger evidence than raw announcement counts.
A fabless model converts partner capacity into operating leverage but concentrates foundry, memory and advanced-packaging dependencies.
Fabless supply chain
Design and softwareNVIDIA
→
Wafer fabricationTSMC / Samsung
→
HBM and memorySK hynix / Micron / Samsung
→
Advanced packagingCoWoS and OSAT capacity
→
Assembly and systemsHon Hai / Wistron / Fabrinet and partners
NVIDIA controls product architecture and demand generation but relies on a concentrated network of manufacturing partners. The model turns this into shipment timing, gross-margin and inventory risks rather than treating every supplier headline as a direct Revenue shock.
A rack ships only when every non-substitutable component and integration step is available. An incremental wafer has no near-term financial value if HBM, packaging, networking, power delivery or rack integration is missing. We therefore model supply as a minimum-capacity constraint rather than a sum of supplier announcements.
For an event, the first question is whether it changes the binding constraint. If it does, the second is whether the impact changes units, timing, costs or mix. Only then is a forecast adjustment considered.
The FY2023 inventory correction shows why recent margins should not be treated as mechanically permanent. The subsequent Data Center mix shift created operating leverage at a scale the earlier company had not demonstrated. Our forecast preserves high margins but fades them as competition, systems content and growth normalization increase.
Data Center represented roughly 90% of FY2026 end-market Revenue. This creates exceptional exposure to AI infrastructure and makes diversification claims sensitive to how rapidly Edge, Gaming, Automotive and other end markets grow from much smaller bases.
The fabless model allows capital expenditure to remain low relative to Revenue, but the economic asset base extends beyond reported PP&E into supplier commitments, inventory, working capital, software development and ecosystem investment.
The forecast is a transparent Revenue and margin bridge tested against simpler controls, with point-in-time leakage controls.
Forecast architecture
Point-in-time actuals and guidance→Revenue control models→Driver and segment assumptions→Margin / EPS bridge→Frozen control→Event challengers→Promotion gates
The control forecast is frozen before event effects are evaluated. This avoids claiming that a narrative improved a forecast when its assumptions were already embedded in the baseline.
Models are evaluated with expanding-window walk-forward backtests at fixed horizons such as T-90, T-60, T-30, T-7 and T-1. WAPE is primary because it weights errors by the economic scale of actuals; MAE, MAPE, bias, direction and interval coverage remain diagnostic.
A challenger is promoted only if it improves matched-period error, remains stable in recent periods, has adequate bootstrap support, behaves consistently across adjacent horizons and survives false-discovery control. No event-aware Revenue or EPS challenger currently passes those gates.
WAPE = Σ |actual − forecast| ÷ Σ |actual|
11
Revenue, Margin, EPS and Cash Flow Forecasts
The base case carries strong growth through Rubin, then deliberately fades growth and margin as scale and competition rise.
Base-case annual forecast
Revenue growth falls deliberately as the base expands. Adjusted operating margin remains near the mid-60s through FY2029 before easing, reflecting continued gross-margin strength partly offset by rising operating investment.
The bridge is intentionally explicit. Revenue and gross margin dominate earnings, but operating expense, tax, non-operating income and share count are independently modelled. This prevents an LLM or narrative label from directly producing EPS.
Scenario forecast
Scenario
FY2027 Revenue
FY2028 Revenue
FY2028 gross margin
FY2028 adj. EPS
Value / share
Bear
$374.3bn
$467.5bn
72.7%
$10.28
$188
Base
$394.0bn
$550.0bn
75.2%
$12.76
$283
Bull
$409.8bn
$621.5bn
76.7%
$14.86
$419
12
News, Events and Forecast Revision Research
News is allowed to challenge the forecast only when a dated event maps to a measurable financial path and improves walk-forward error.
From news to a forecast challenge
Graph nodes61
entities and financial concepts
Relationships119
evidence-backed graph edges
Event records37,464
point-in-time event ledger
Financial paths82,642
event-to-metric candidates
Raw articles, IR and policy notices→deduplicated canonical event→entity and graph path→financial compartment→bounded event feature→walk-forward challenger→promotion or rejection
News about a customer or supplier is relevant only when the graph establishes a relationship and the event changes a measurable exposure. A customer product launch may have no forecast effect; a funded capex reduction at a concentrated customer may change the Revenue path.
hyperscaler AI capex -> accelerator demand -> Data Center Revenue
$13.51bn
23.8%
22.4%
Improved
Blackwell production ramp
2025-Q4
Blackwell production and supply -> system shipments -> Data Center Revenue and gross margin
$39.33bn
2.5%
0.0%
Improved
H20 export restriction
2026-Q1
license requirement -> China demand and inventory -> Revenue and gross margin
$44.06bn
1.1%
3.7%
Worsened
The mixed results are the point. Generative-AI demand and the Blackwell ramp improved the tested forecasts, while the gaming reset and H20 restriction adjustments worsened them. Event interpretation is not promoted merely because the story is intuitively plausible.
Exact matched-period T-30 samples; lower WAPE is better.
Current decision: retain the no-news control
The event-aware Revenue model produced 5.24% WAPE versus 5.21% for the control. Adjusted EPS improved by only 0.03 percentage points on ten periods and lacked bootstrap support. GAAP EPS deteriorated materially. No event challenger is used in the current published forecast.
This does not mean news is useless. It means the event ledger currently provides explanation, monitoring and challenger features, while the conservative control remains the forecast of record until an event model proves incremental accuracy.
13
Valuation
FY2028 adjusted EPS and a through-cycle P/E set the target; DCF remains an independent terminal-assumption stress test.
Primary valuation: FY2028 adjusted EPS
The base value is $283, rounded to a $285 model target. It applies 22.0x to FY2028 adjusted EPS of $12.76 and adds $2.80 of net cash per share.
The selected multiple is below NVIDIA's trailing P/E and reflects a shift from scarcity growth toward a still-superior but normalizing earnings profile.
The configured five-year FCFF DCF produces $199.52 per share, materially below the P/E method. We do not average the two. The gap is disclosed because it shows how much of the P/E target depends on earnings duration beyond the explicit forecast window.
The DCF is a stress test, not a hidden second target. Its result moves sharply with WACC and terminal growth because a large share of value lies beyond FY2031.
Peer context is informative, not mechanically comparable
Company
Role
P/E
EV / Sales
EV / FCF
Gross margin
ROIC
NVDA
subject company
31.6x
19.8x
42.1x
74.1%
63.0%
AMD
accelerator and GPU competitor
178.9x
23.9x
104.6x
50.3%
6.2%
AVGO
custom AI silicon and networking
62.4x
24.9x
57.5x
67.0%
19.5%
MRVL
custom silicon and interconnect
71.7x
21.3x
111.7x
50.6%
5.0%
ANET
data-center networking
59.1x
22.4x
41.2x
63.5%
22.4%
ARM
CPU architecture and AI compute IP
340.8x
61.5x
318.1x
94.6%
7.2%
TSM
foundry and advanced-packaging partner
27.8x
13.5x
53.7x
64.2%
27.1%
MU
HBM and memory supplier
21.8x
12.0x
41.4x
72.6%
44.0%
This is a role-based reference set spanning accelerators, custom silicon, networking, foundry and memory. It is not a statistically homogeneous peer group, so median multiples are not used as a direct target.
Each risk is connected to a model variable, a valuation sensitivity and an observable monitoring signal.
Risk map
Quantified single-factor sensitivities
Risk
Probability
Impact
Mechanism
Value / share
Impact vs base
AI infrastructure digestion
Medium
High
Hyperscaler and AI-cloud capex slows after rapid capacity additions.
$203
-28.6%
Export controls and China
High
High
Licensing and product restrictions reduce addressable demand and create inventory charges.
$236
-17.3%
Rubin transition execution
Medium
High
Rack-level complexity delays shipments or creates transition costs.
$227
-20.3%
Foundry, CoWoS and HBM constraints
Medium
Medium
Non-substitutable upstream capacity limits system availability.
$254
-11.0%
Custom ASIC and accelerator competition
High
Medium
Merchant and internally designed accelerators capture selected workloads.
$225
-21.1%
Customer concentration and financing
Medium
High
A major direct or indirect customer delays deployment or cannot finance capacity.
$228
-19.8%
Power and data-center availability
High
Medium
Grid, permitting and construction bottlenecks defer AI factory commissioning.
$257
-9.9%
Valuation compression
Medium
High
The market reduces the forward multiple as growth normalizes.
$207
-27.3%
Each value is a single-factor sensitivity, not a probability-weighted target. Risks can co-occur and interact; the table is designed to show transmission and scale rather than simulate a complete joint distribution.
Catalyst and monitoring calendar
Catalyst
Window
Monitor
Financial path
FY2027 Q2 results
August 2026 estimate
Revenue versus $91.93B model forecast; gross margin and Q3 guidance
actual shipments and mix -> Revenue/gross margin -> EPS
Vera Rubin volume ramp
Second half FY2027
partner availability, rack deployment and supply readiness
product transition -> units/mix/network attach -> Data Center Revenue
Hyperscaler capex updates
Quarterly
AI infrastructure capex, depreciation and data-center capacity commentary
customer capital allocation -> accelerator demand -> Revenue
H200 China licensing
Policy dependent
approved shipments, inspection/tariff economics and customer acceptance
export access -> addressable demand/inventory -> Revenue and margin
Networking attach
Quarterly
InfiniBand, Spectrum-X, NVLink and BlueField demand
rack-scale architecture -> content per system -> Revenue/mix