Investment View
12 Aug 2026 close · [MP]
No approved target
Management guidance
17:00 IST
Demand is visible; deployment, financing and depreciation decide the economics.
Nebius has converted AI-infrastructure demand into a $3.0bn June ARR run-rate and major customer commitments. The investment question is whether powered capacity can come online fast enough—and at sufficient utilization—to absorb Q2 capex of $5.657bn, interest and depreciation without excessive dilution. [E1] [E2] [E3] [E4] [E5] [MP]
What must go right
Contracted demand must clear deployment and acceptance gates at utilization that absorbs depreciation and financing cost.
What is priced imperfectly
ARR and power commitments are visible; timing, owned-versus-partner capital and per-share conversion are less settled.
Why no rating
No approved annual capacity schedule or intrinsic-value assembly was available at the cut.
Investment Summary
Nebius has converted AI-infrastructure demand into a $3.0bn June ARR run-rate and major customer commitments. The investment question is whether powered capacity can come online fast enough—and at sufficient utilization—to absorb Q2 capex of $5.657bn, interest and depreciation without excessive dilution.
| Q2 / June 2026, $m | Q2 2025 | Q2 2026 | Comment |
|---|---|---|---|
| Revenue | 105.1 | 582.3 | +454% |
| AI Cloud revenue | 93.7 | 574.9 | +514% |
| Adjusted EBITDA | (21.0) | 236.2 | 41% group margin |
| GAAP operating result | — | (175.9) | Includes D&A and acquisition costs |
| GAAP continuing net result | — | (190.4) | $(0.68) diluted EPS |
| Cash | — | 8,042.1 | June 30 balance |
| Q2 capex | — | 5,657.4 | GPUs and data centers |
US GAAP is the reporting anchor; adjusted EBITDA retains the issuer definition.
AI Factory Thesis
The AI-factory thesis is a conversion problem. Large contracts improve demand visibility and prepayments help fund hardware, but revenue and GAAP earnings depend on when powered capacity is commissioned and utilized.
| Driver | Current evidence | Failure mode |
|---|---|---|
| Demand | $3.0bn ARR | Delayed or cancelled deployment |
| Contract quality | >$20m ACV/MW in Q2 deals | Pricing or utilization below contract economics |
| Funding | 50–60% capex prepay in ~70% deals | More corporate debt or equity required |
| Capacity | 5GW contracted-power target | Power does not equal energized racks |
| Payback | 1 year 10 months estimate | Forecast cost or capacity timing misses |
Falsification is economic: ARR can grow while GAAP EPS and cash returns deteriorate if commissioning or utilization lags the asset base.
Digital Twin and Operating System
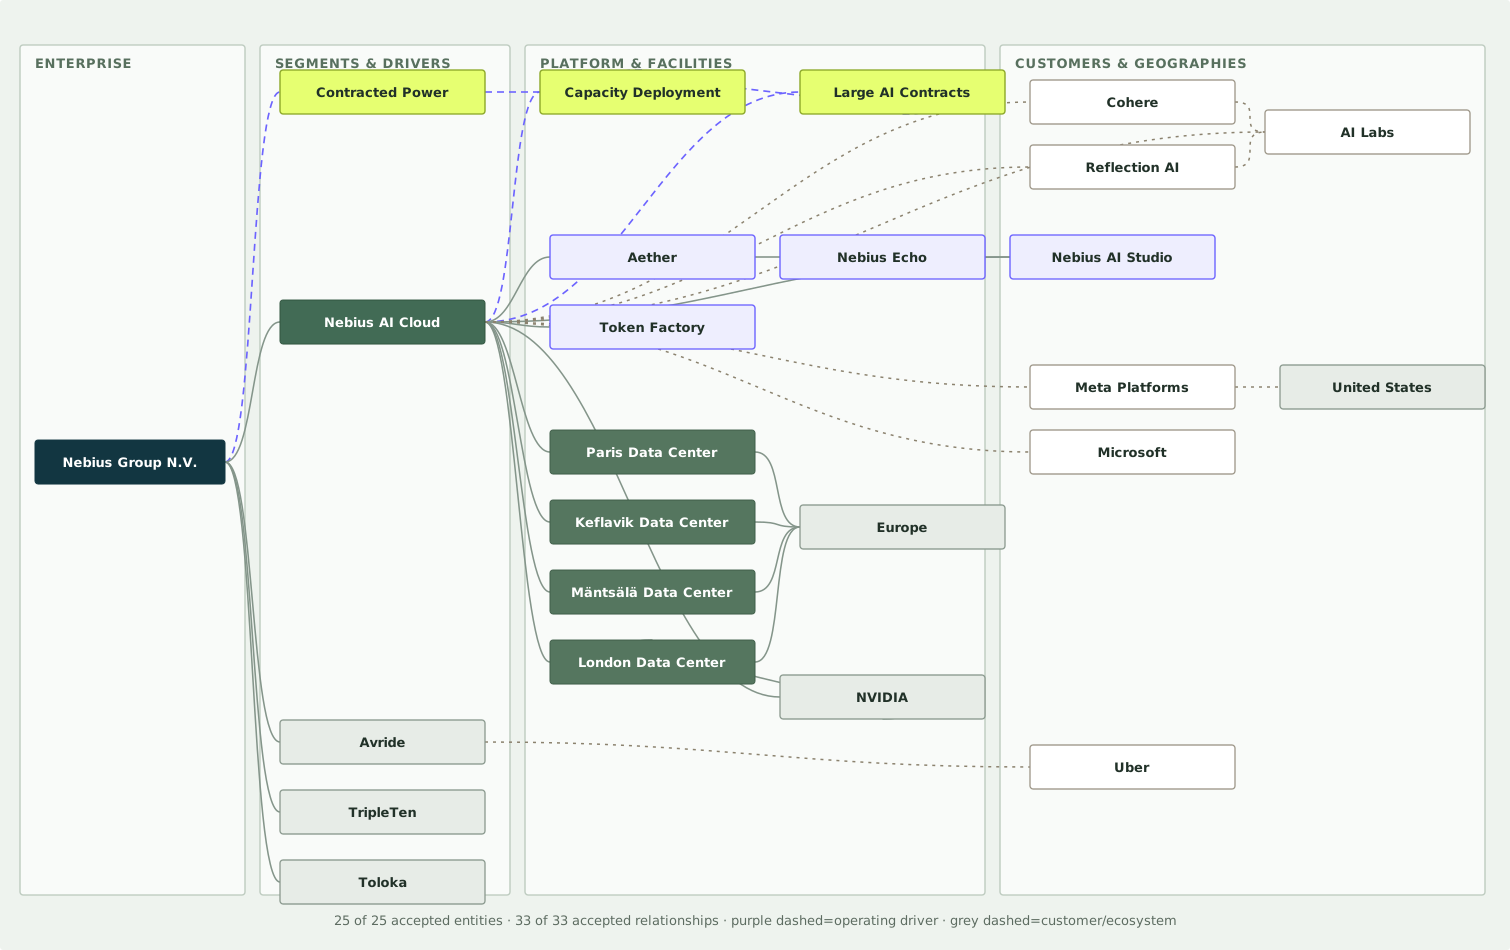
The twin centers on Nebius AI Cloud and preserves separate routes for facilities, products, NVIDIA supply, direct customers, AI labs, geographies, Avride, TripleTen and the Toloka investment. Every accepted entity and relationship is shown; topology is not financial weighting.
| Source entity | Relationship | Target | Investment relevance |
|---|---|---|---|
| Nebius Group | Depends on | Contracted Power | Defines build ceiling |
| Nebius AI Cloud | Requires | Capacity Deployment | Defines revenue timing |
| Nebius AI Cloud | Serves | Meta / Microsoft / Cohere / Reflection / AI Labs | Customer and concentration route |
| Nebius AI Cloud | Offers | Aether / AI Studio / Token Factory | Platform and service mix |
| Nebius AI Cloud | Purchases from | NVIDIA | Accelerator supply route |
| Avride | Strategic partner | Uber | Separate mobility option |
Capacity and Contracted Power
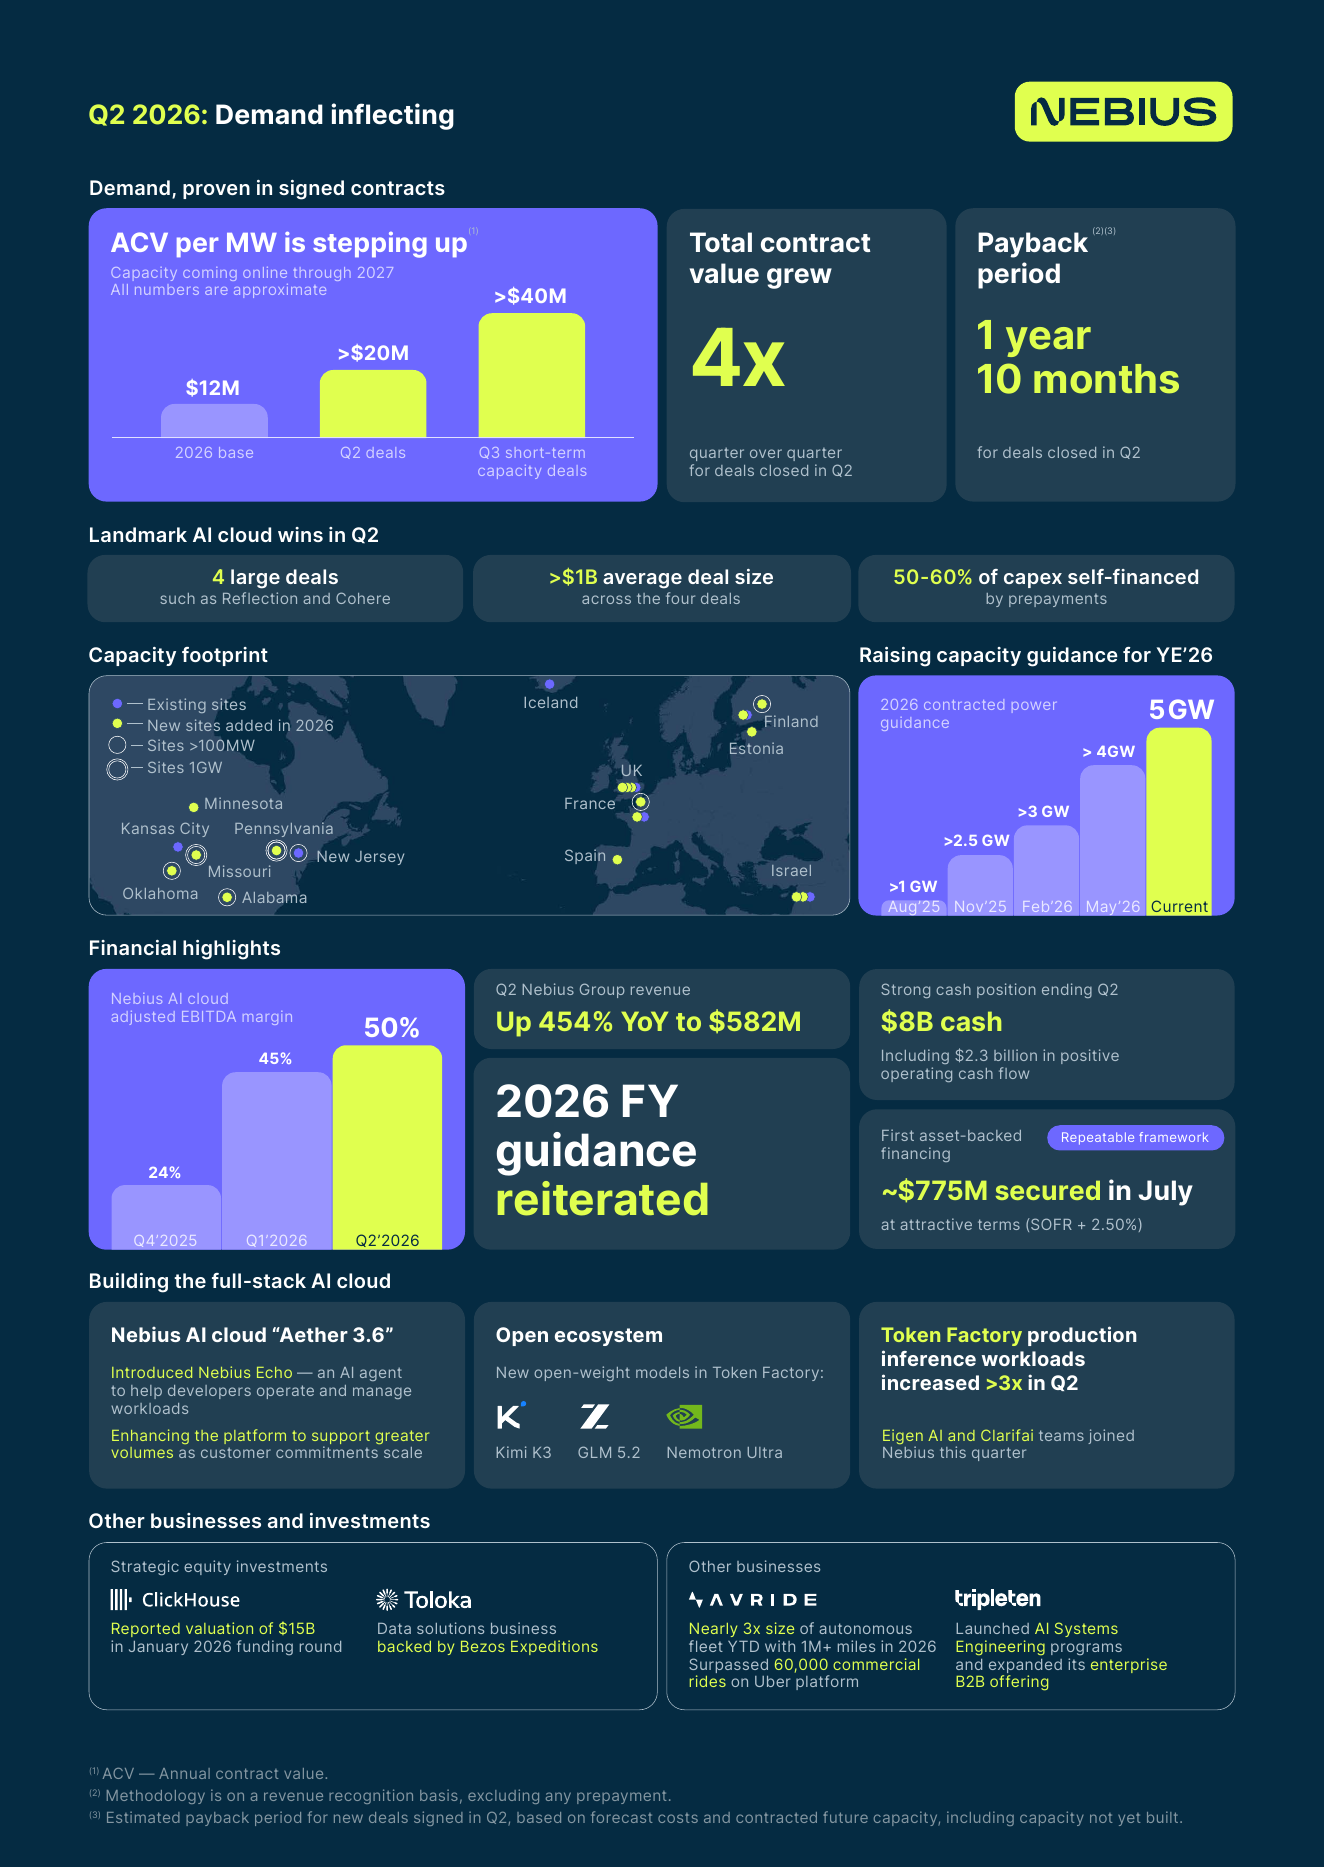
Nebius ended June at $3.0bn ARR and raised its 2026 contracted-power target to 5GW. Contracted power defines the build ceiling; energized racks, delivered GPUs, networking and customer acceptance determine when capacity begins generating revenue. [E1] [E2]
| Capacity field | Current evidence | Recognition boundary |
|---|---|---|
| Contracted power | 5GW 2026 target | Not energized capacity |
| Deployment | >1GW/year planned from 2027 | Requires construction and equipment |
| Microsoft | All current capacity tranches delivered | Contract-specific evidence |
| Second Meta agreement | Early-2027 capacity target | Not Q3 revenue |
| Geographies | US and European expansion | Site-level timing remains required |
Customers and Commitments
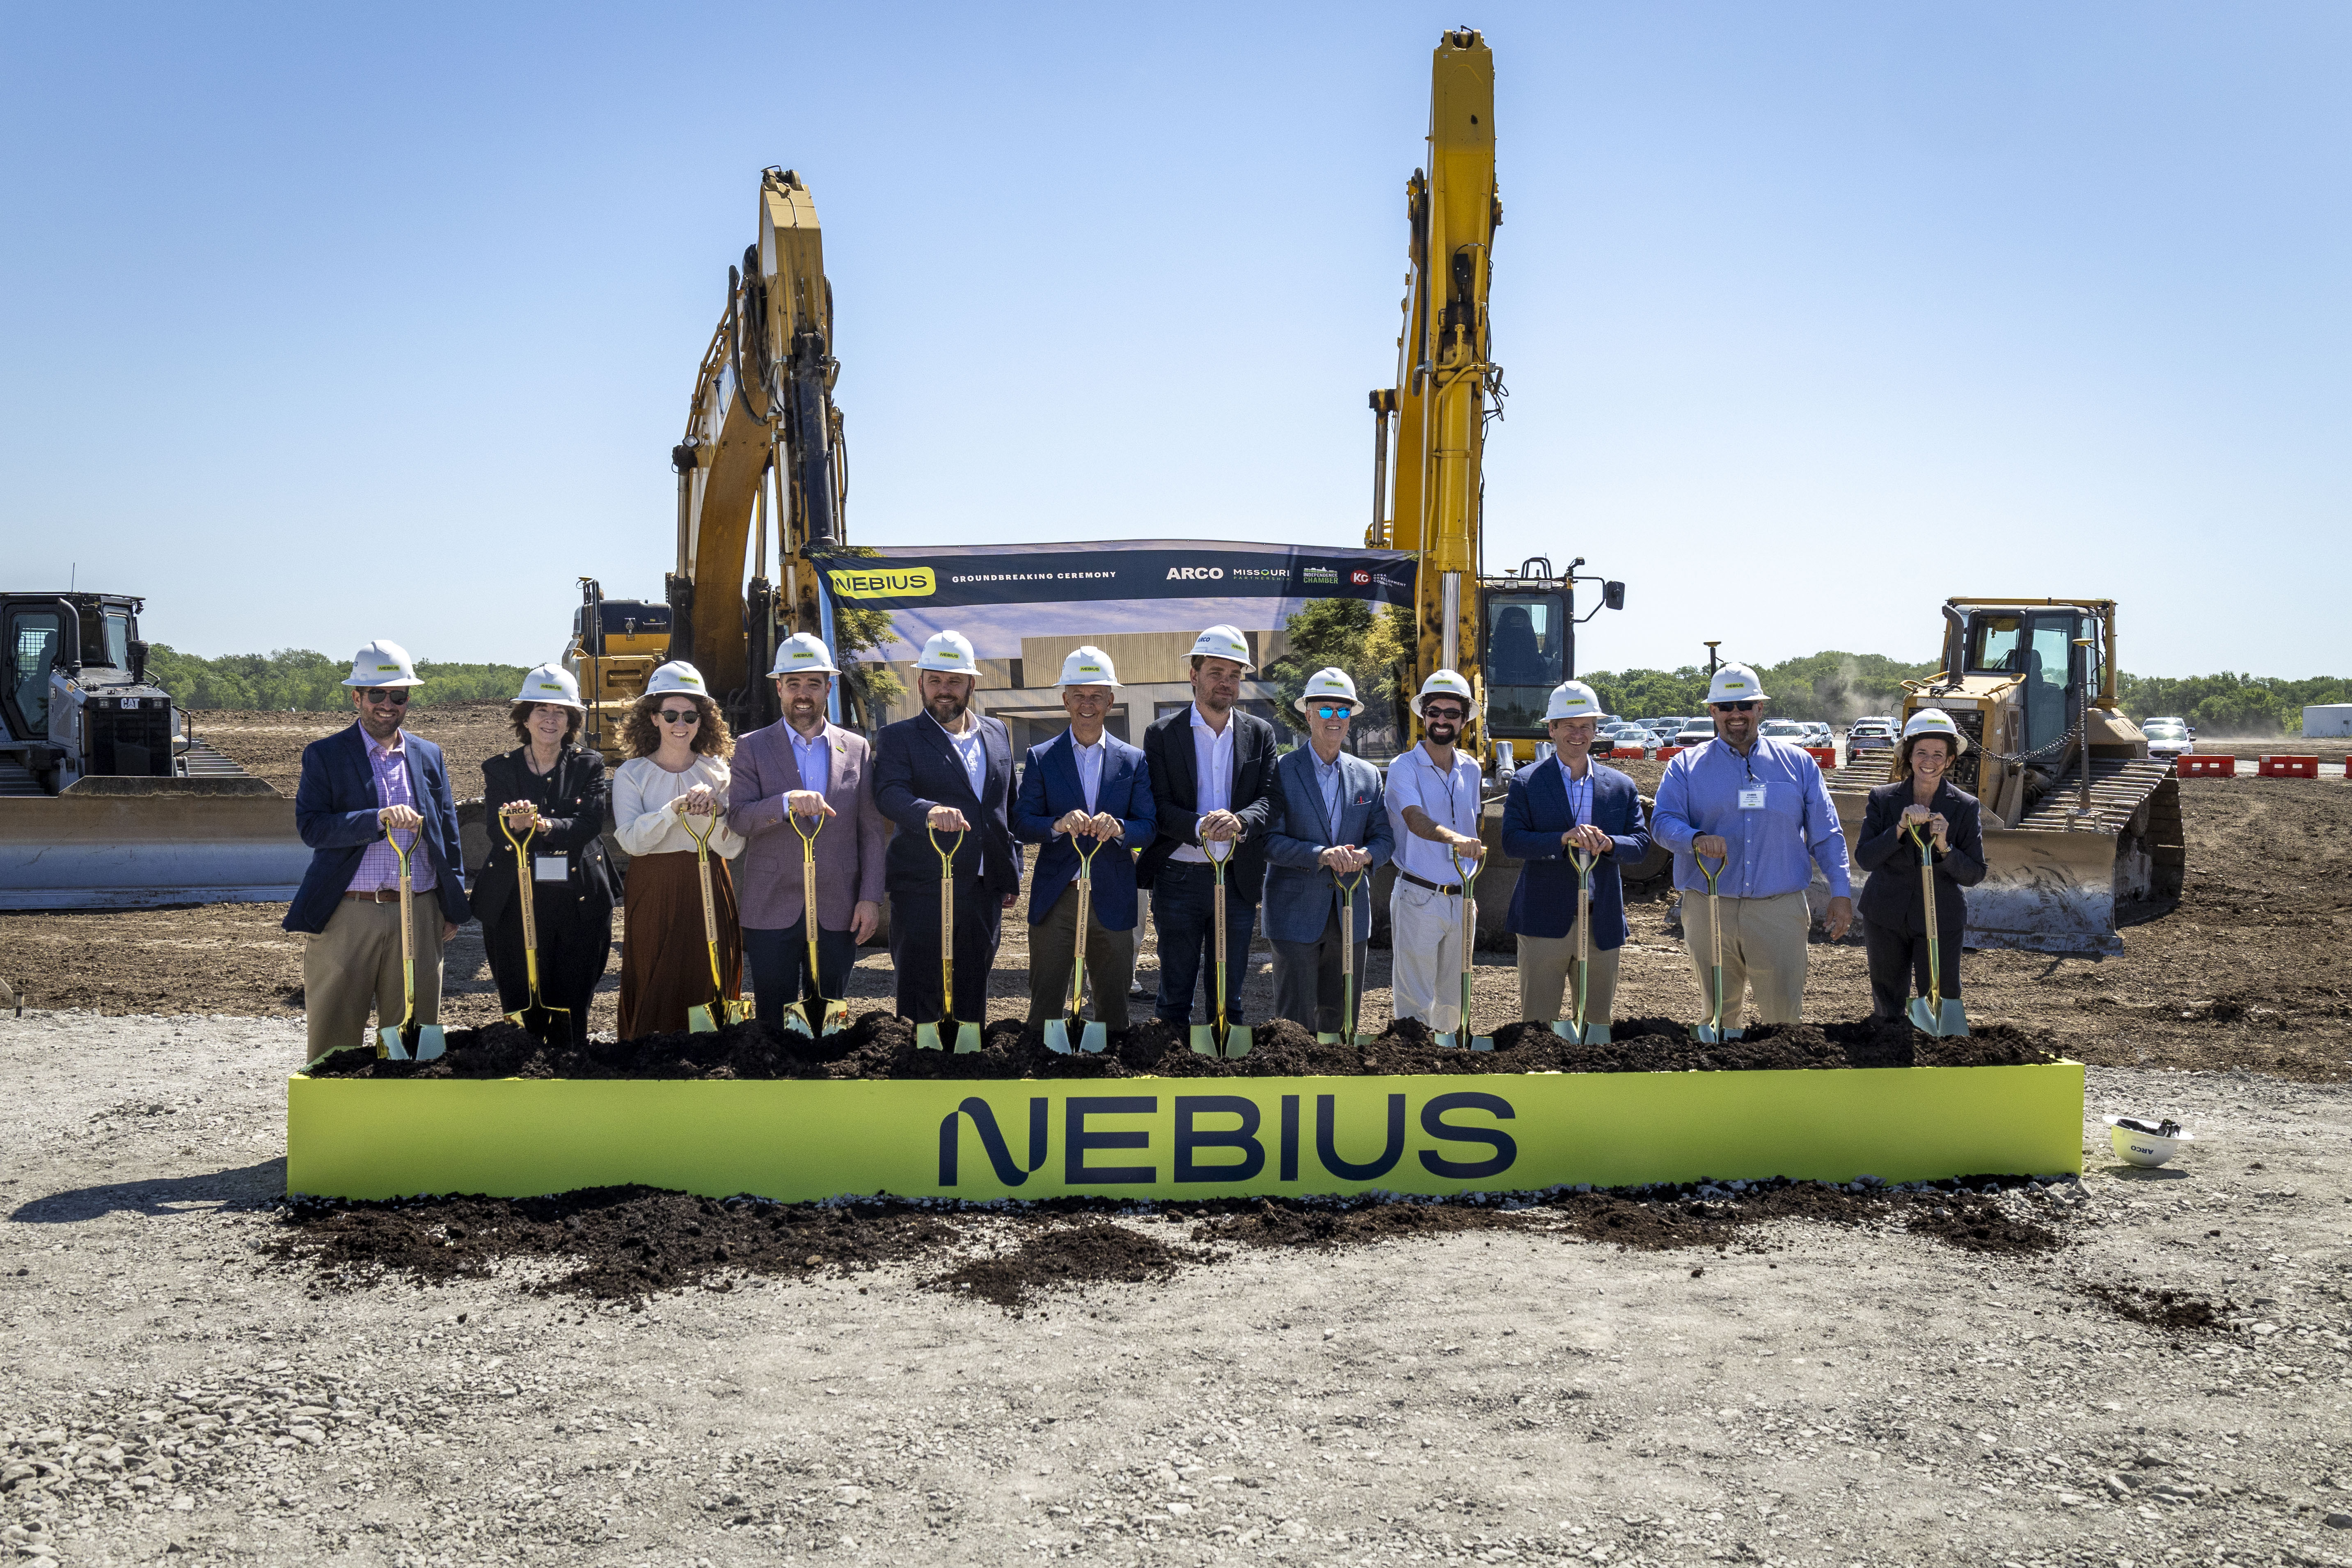
Large commitments create demand visibility but not immediate revenue. Most Q2 wins are tied to late-2026 capacity and contribute mainly in 2027; Q2 agreements averaged more than $20m annual contract value per MW, with customer prepayments covering 50–60% of associated capex in about 70% of deals. [E2] [E4]
| Customer route | Evidence | Forecast treatment |
|---|---|---|
| Reflection AI | Multi-year training and inference agreement | Capacity-timed |
| Cohere | Enterprise agentic-AI partnership | Capacity-timed |
| Microsoft | All disclosed tranches delivered | Current contract evidence |
| Meta | Second agreement buildout for early 2027 | No Q3 recognition assumed |
| AI labs | Direct customer type in twin | No concentration percentage inferred |
Products and Platform
Nebius AI Cloud generated $574.9m of Q2 revenue. Aether, AI Studio, Token Factory and Echo extend the stack above raw GPU capacity; Avride and TripleTen remain distinct options. Utilization and higher-value service mix—not product count—drive unit economics. [E1] [E2]
| Platform route | Current evidence | Economic question |
|---|---|---|
| Aether 3.6 | Core cloud platform release | Does platform scale with contracted capacity? |
| Token Factory | Inference workloads >3× in Q2 | Does service mix raise utilization? |
| Nebius Echo | Agent interface complementing AI Studio | Adoption and monetization not separately disclosed |
| Avride / TripleTen | Distinct group options | No AI Cloud revenue allocation assumed |
| NVIDIA | Accelerator supplier | Delivery and architecture integration risk |
Product breadth supports customer utility; it is not a substitute for utilization, revenue recognition or gross-margin evidence.
Funding the Build
Q2 capex was about $5.7bn. June cash was $8.042bn and gross debt $8.546bn; deferred revenue of $5.975bn is a contract liability, not debt. D&A reached $259.7m after the server/network useful-life policy moved from four to five years. [E1] [E2] [E5]
| Funding route | Current evidence | Classification |
|---|---|---|
| Cash | $8.042bn at 30 June | Balance-sheet liquidity |
| Secured debt | $775m in July at SOFR + 2.50% | Post-quarter financing |
| Customer prepayments | >$9bn expected in 2026 | Contract funding; not revenue |
| ATM | $2.8bn gross proceeds through 30 June | Equity dilution |
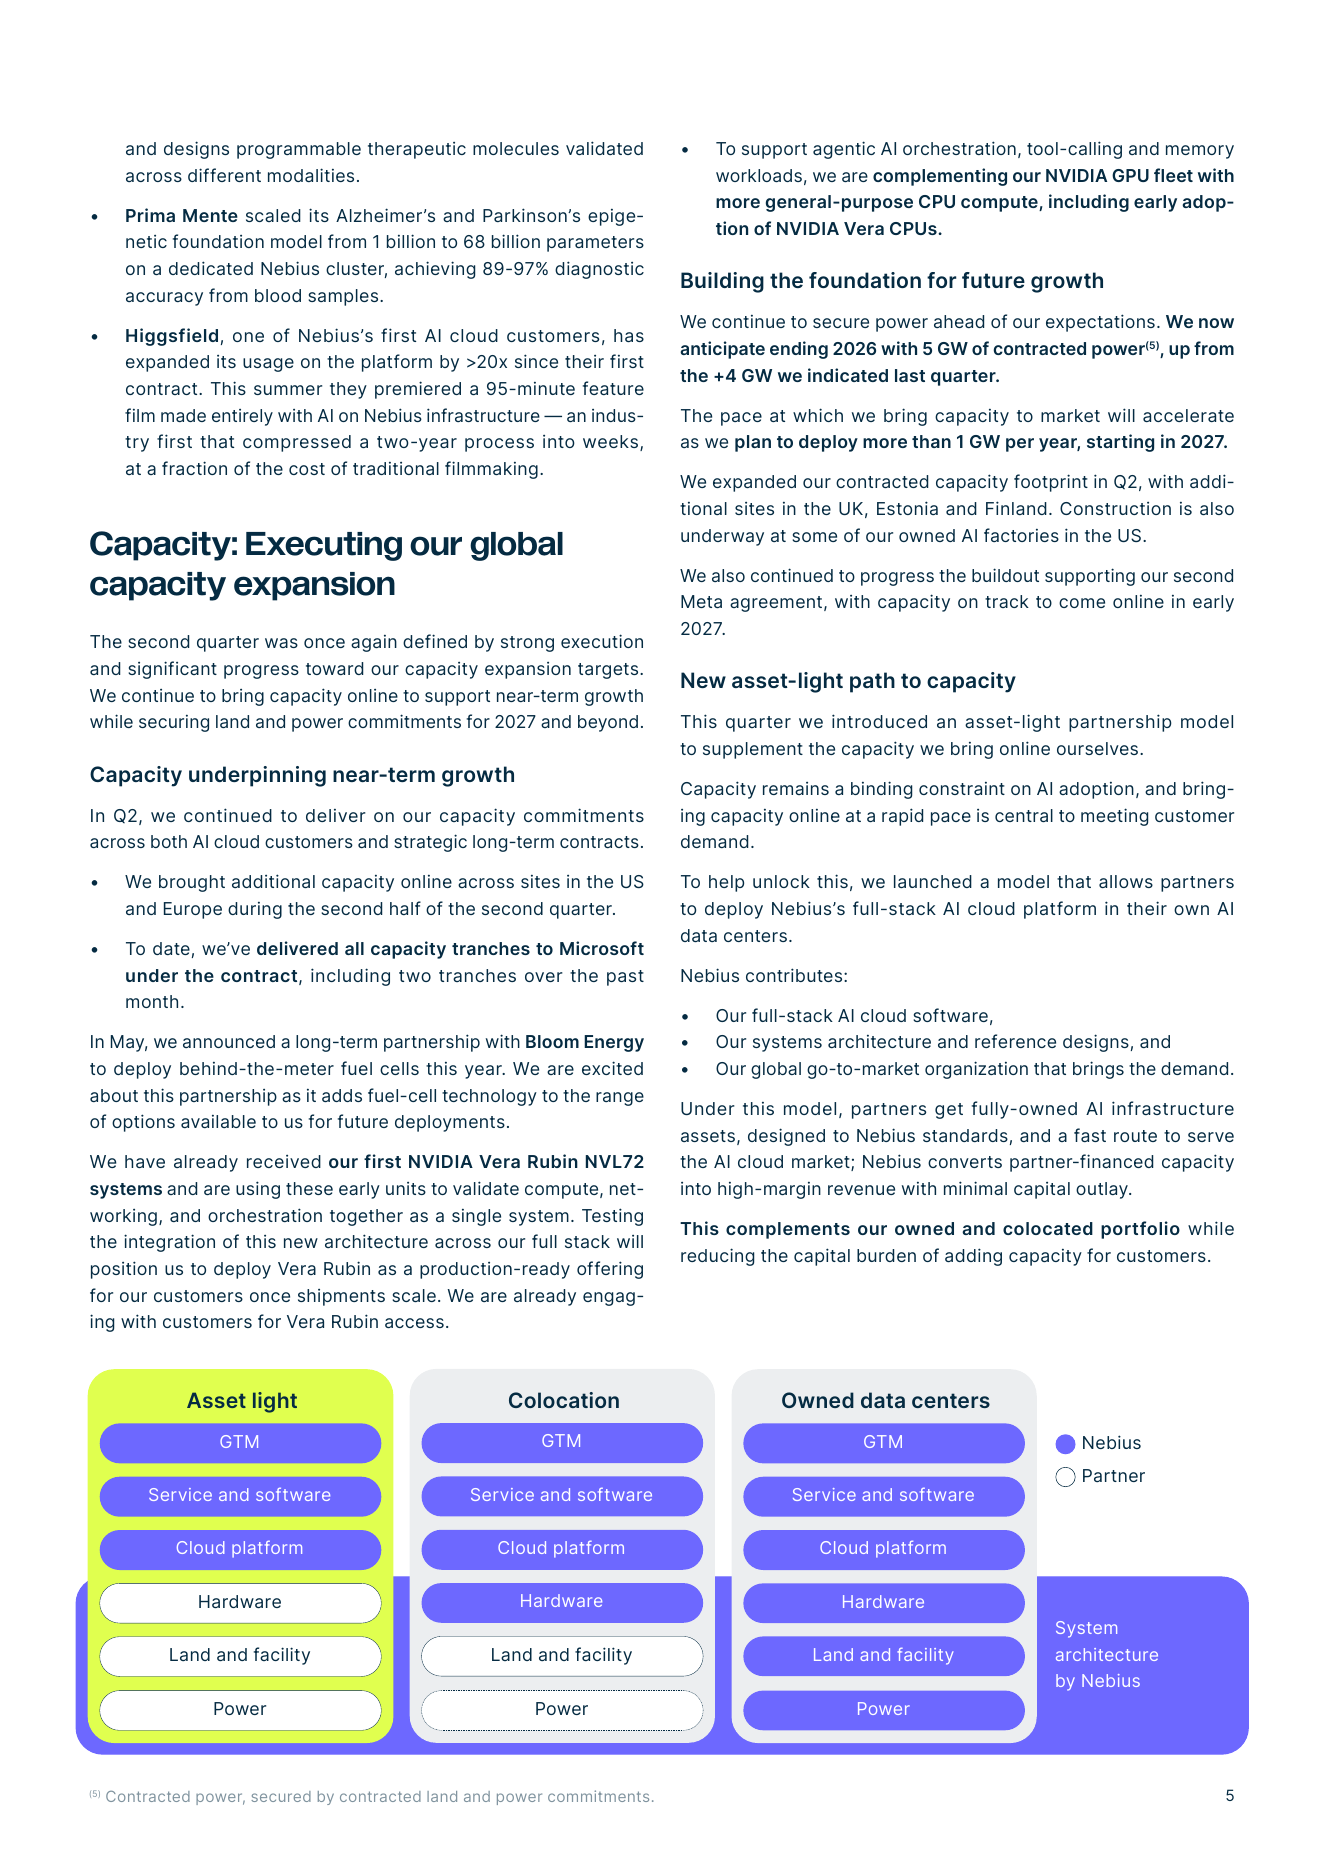
| Asset-light model | Partner owns land, power and hardware | No quantified capex or margin split assumed |
The ownership diagram explains who funds each layer; it does not prove a margin or capex advantage until actual contract economics are disclosed.
Financial Record and Accounting
The issuer Q2 release is the source of record for current actuals. GAAP and non-GAAP measures, continuing operations and the five-year server/network useful life remain explicit.
| Adjusted EBITDA reconciliation | US$ m |
|---|---|
| Continuing GAAP net loss | (190.4) |
| Add: D&A | 259.7 |
| Add: stock-based compensation | 102.5 |
| Add: acquisition / corporate transaction costs | 49.9 |
| Less: interest income | (24.1) |
| Add: interest expense | 119.1 |
| Less: equity-method income | (12.7) |
| Less: other income | (81.5) |
| Add: income-tax expense | 13.7 |
| Adjusted EBITDA† | 236.2 |
Accounting discipline: † issuer-defined non-GAAP. Adjusted EBITDA is not combined with GAAP EPS, and deferred revenue is not debt.
ARR-to-Revenue Evidence Gate
End-June ARR annualizes the final month of AI Cloud revenue. It does not by itself produce a Group revenue forecast, because scope, contract start, commissioning, acceptance and non-cloud revenue remain separate.
| Evidence field | Current status | Treatment |
|---|---|---|
| June AI Cloud ARR | $3.0bn = last-month AI Cloud revenue × 12 | Actual run-rate observation |
| Quarterly run-rate | $750m AI Cloud scope | Not Group revenue |
| Short-term deal | Signed in Q3; expected Q4 go-live | No Q3 recognition |
| Most Q2 wins | Late-2026 capacity; mainly 2027 contribution | No automatic Q3 revenue |
| Q3 Group revenue / EPS | Scope and timing do not reconcile | Withheld |
Withholding an unsupported point estimate is more decision-useful than presenting an arithmetically precise but scope-inconsistent forecast.
FY2026 Revenue Guidance Test
Management reiterated its FY2026 outlook; the numerical $3.0–3.4bn revenue range was disclosed in the Q1 shareholder letter. H1 actual revenue was $981.3m. The sensitivity below shows the Q4 revenue required under three hypothetical Q3 Group-revenue observations.
| Hypothetical Q3 Group revenue | Required Q4 for $3.0bn FY | Required Q4 for $3.4bn FY |
|---|---|---|
| $650.0m | $1,368.7m | $1,768.7m |
| $750.0m | $1,268.7m | $1,668.7m |
| $900.0m | $1,118.7m | $1,518.7m |
Forward status: mechanical consistency test only. The report does not promote a Q3 revenue, net-income or EPS forecast.
Unit Economics and Depreciation
Deal economics are improving on management's estimates, but the asset base is expanding rapidly. Cash, debt, contract liabilities, capex, D&A and prepayments must therefore remain separate analytical objects.
| Metric | Current evidence | Analytical use |
|---|---|---|
| Cash | $8.042bn | 30 June 2026 |
| Gross debt | $8.546bn | Current + noncurrent |
| Net debt | $0.504bn | Gross debt less cash |
| Deferred revenue | $5.975bn | Contract liability; not debt |
| Q2 capex | $5.657bn | GPUs and data centers |
| Expected 2026 prepayments | >$9bn | Management expectation |
The five-year useful life reduces annual depreciation relative to the prior four-year policy; it does not change cash capex or prove utilization.
Observed EV / ARR and DCF Boundary
The market snapshot below is mechanical, not intrinsic value. It combines the 12 August share price with 271.855m basic shares outstanding as of 30 June, reported cash and debt, and end-June AI Cloud ARR; no multiple is selected as fair value.
| Role | Method | Evidence requirement |
|---|---|---|
| Primary | EV / revenue or EV / ARR | Best suited while GAAP earnings and FCF are negative |
| Cross-check | Capacity-adjusted DCF | Blocked pending annual MW, capex and depreciation schedules |
| Equity bridge | EV + cash − gross debt | Cash $8.042bn; debt $8.546bn; deferred revenue is not debt |
| Required input | Why it matters | Status |
|---|---|---|
| Capacity schedule | MW energized by quarter | Missing |
| Revenue conversion | ARR / MW and utilization | Missing |
| Capex and D&A | Owned versus partner-financed build | Missing |
| Dilution | ATM / equity and diluted share path | Missing |
The observed 23.66× is not a target multiple. No implied return, target price, DCF or rating is presented.
Risks and Catalysts
Risks and catalysts enter a scenario only after the affected capacity, accounting line, timing and observable evidence are defined. Commitments and price reactions are not treated as realized revenue or causality.
| Monitoring gate | Current status | What changes the model |
|---|---|---|
| ARR | $3.0bn at June | New run-rate and recognized revenue |
| Contracted power | 5GW 2026 target | Site-level energization |
| Q2 commercial economics | >$20m ACV/MW; 1y10m payback estimate | Actual utilization and cost |
| Prepayments | 50–60% capex in ~70% deals | Cash receipt and contract classification |
| Capacity deployment | Mainly late 2026 / 2027 | Commissioning and customer acceptance |
| Dilution | ATM used in Q2 | Executed shares and per-share bridge |
Sources, Methods and Disclosures
SEC filings and issuer financial materials are the source of record for current actuals. Market data are supporting observations. Forward scenarios and formulas are analyst calculations.
| ID | Source | Published / snapshot | Locator | Link |
|---|---|---|---|---|
| E1 | Q2 2026 earnings release | 2026-08-12 | Highlights; consolidated statements; non-GAAP reconciliation | Open · www.sec.gov |
| E2 | Q2 2026 shareholder letter | 2026-08-12 | Q2 letter pp. 2–4, 9–12 | Open · www.sec.gov |
| E3 | 2025 Form 20-F | 2026-04-30 | Business; Risk Factors; financial statements | Open · www.sec.gov |
| E4 | Meta infrastructure agreement | 2026-03-16 | Full Meta agreement exhibit | Open · www.sec.gov |
| E5 | Secured debt financing | 2026-07-17 | Full secured-debt exhibit | Open · www.sec.gov |
| MP | NBIS historical market price | 2026-08-12 | 12 Aug 2026 daily close | Open · finance.yahoo.com |
| E6 | Nebius media kit | 2026-08-13 | Finland data-centre media asset | Open · nebius.com |
| E7 | Independence AI factory groundbreaking | 2026-05-12 | Newsroom article and image | Open · nebius.com |
| E8 | Q1 2026 shareholder letter | 2026-05-13 | Q1 letter p. 2 guidance | Open · assets.nebius.com |
Key limitations
- No Q3 point forecast is presented because timing and Group-versus-AI-Cloud scope do not reconcile.
- No approved annual capacity schedule or valuation assembly was available at the evidence cut.
- Contracted power, commitments, prepayments and ARR are not recognized revenue.
- Issuer visuals are credited at point of use; analytical charts and the digital twin are report-created.
- This report is information for discussion, not investment advice or an offer to transact.
Forecasts, scenarios and valuations are uncertain and may differ materially from actual outcomes. Investors should independently assess suitability, liquidity, taxes and risk.