Investment View
12 August 2026 close [E7]
-8.8% implied return
+22% year on year
Excludes portfolio marks
Method spread remains material
AI demand is visible; cash returns still need to catch up.
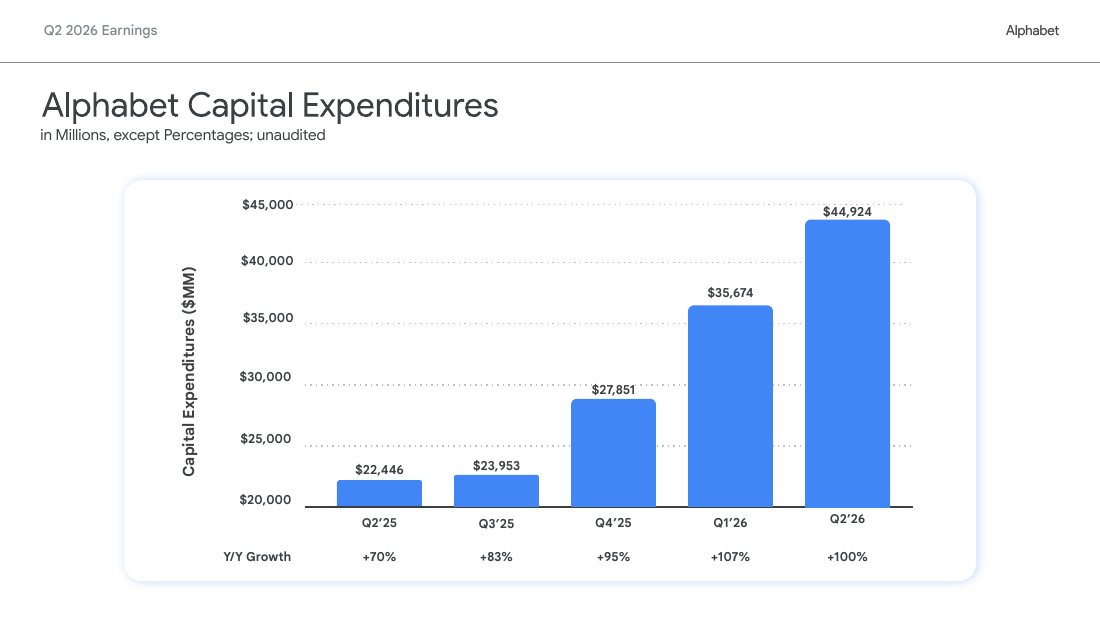
Search is growing through the AI transition, Google Cloud has become a second earnings engine, and the balance sheet can fund the infrastructure build. The central debate is whether utilization and monetization rise quickly enough to recover a capex run-rate that reached $44.9bn in Q2. Our $311 valuation indication sits below the reference price and spans two methods with materially different answers, so we do not attach a directional rating.
Core earnings
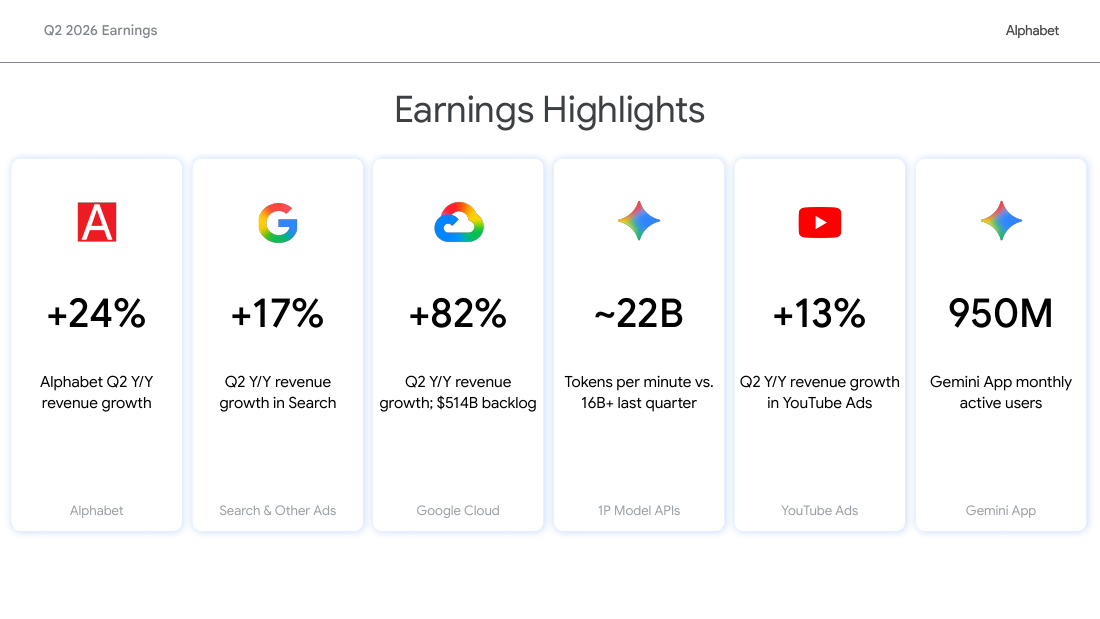
Q2 revenue rose 24%; Search grew 17%, Cloud 82%, and consolidated operating margin expanded to 34.0%. [E2]
Cash conversion
Q2 FCF was negative $5.9bn as capex doubled to $44.9bn. TTM FCF remained positive at $53.3bn. [E3]
Valuation discipline
A 26× normalized P/E yields $373; a 9.75% WACC DCF yields $249. The 49% spread is itself an investment risk.
Investment Summary
Why the thesis can work
Owned distribution gives Alphabet several routes to monetize the same AI capability: commercial Search, YouTube engagement, paid subscriptions, enterprise workloads and developer consumption.
What has to go right
Search must preserve commercial intent, Cloud backlog must convert into utilized capacity, and depreciation growth must remain below the revenue and gross-profit contribution of new infrastructure.
What would change our view
Search growth below 7% with rising inference cost, Cloud growth below 25% before capex normalizes, or sustained FCFF below our fade path would invalidate the base case.
| FY | Our revenue | Provider average | Difference |
|---|---|---|---|
| 2026 | $495.6bn | $495.3bn | +0.1% |
| 2027 | $602.4bn | $606.0bn | -0.6% |
| 2028 | $712.5bn | $720.3bn | -1.1% |
| 2029 | $834.6bn | $815.7bn | +2.3% |
| 2030 | $956.1bn | $936.3bn | +2.1% |
Provider figures are a supporting cross-check, not a forecast input. [E6]
Where Our View Differs
| Market question | Our view | What proves it | What breaks it |
|---|---|---|---|
| Does AI displace Search? | AI changes the interface faster than the commercial-intent pool. We fade growth; we do not model collapse. | Paid clicks, CPC and commercial-query growth remain positive. | Sub-7% Search growth alongside rising serving cost. |
| Is Cloud growth durable? | Backlog and AI infrastructure demand support a multi-year runway, but Q2 growth is not annualized. | Capacity additions convert with stable or higher Cloud margin. | Backlog stalls or margin falls before growth normalizes. |
| Is capex temporary? | The build is cyclical in cash terms but structurally raises depreciation and power needs. | FCFF turns positive as utilization rises from FY27 onward. | Capex remains above 35% of revenue without corresponding EBIT. |
| How much is Waymo worth? | Potentially material, but not supportable in the weighted valuation today. | Commercial scale and unit economics become auditable. | Funding losses widen without measurable operating density. |
It is whether Alphabet can convert that demand into cash returns at a pace that justifies the current equity value. Adoption metrics support the numerator; infrastructure intensity determines the denominator.
Alphabet System and Digital Twin
Alphabet's operating graph matters because products, distribution, infrastructure and customers are economically connected. Search and YouTube monetize consumer intent; Cloud sells the AI stack to enterprises; shared compute and R&D sit across segments; Other Bets consume capital while retaining long-duration option value.
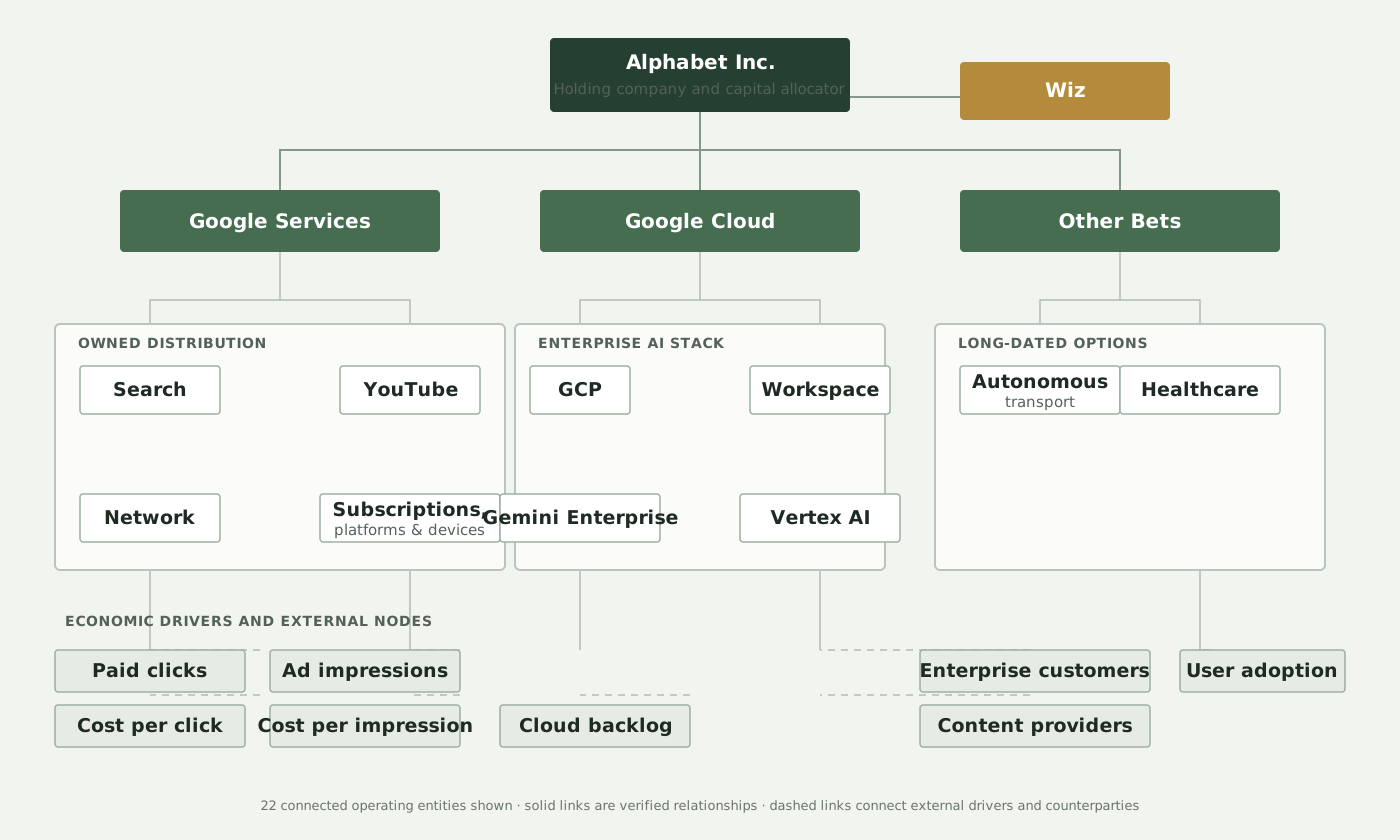
| Graph category | Connected entities shown | Decision use |
|---|---|---|
| Companies | 2 | Alphabet allocation and Wiz contribution to Cloud |
| Reporting segments | 3 | Services, Cloud and Other Bets economics |
| Products and platforms | 10 | Maps revenue to product families and AI routes |
| Business drivers | 5 | Paid clicks, pricing, impressions and backlog |
| Customers and suppliers | 2 | Enterprise demand and YouTube content supply |
Why this changes the forecast
Search is modeled from clicks and yield, Network from impressions and price, and Cloud from capacity-backed demand rather than one consolidated growth rate.
Why this changes valuation
Shared AI cost makes a clean segment SOTP unreliable. We use consolidated P/E and FCFF as primary methods and retain the graph as the audit trail for driver selection.
Search and Monetization
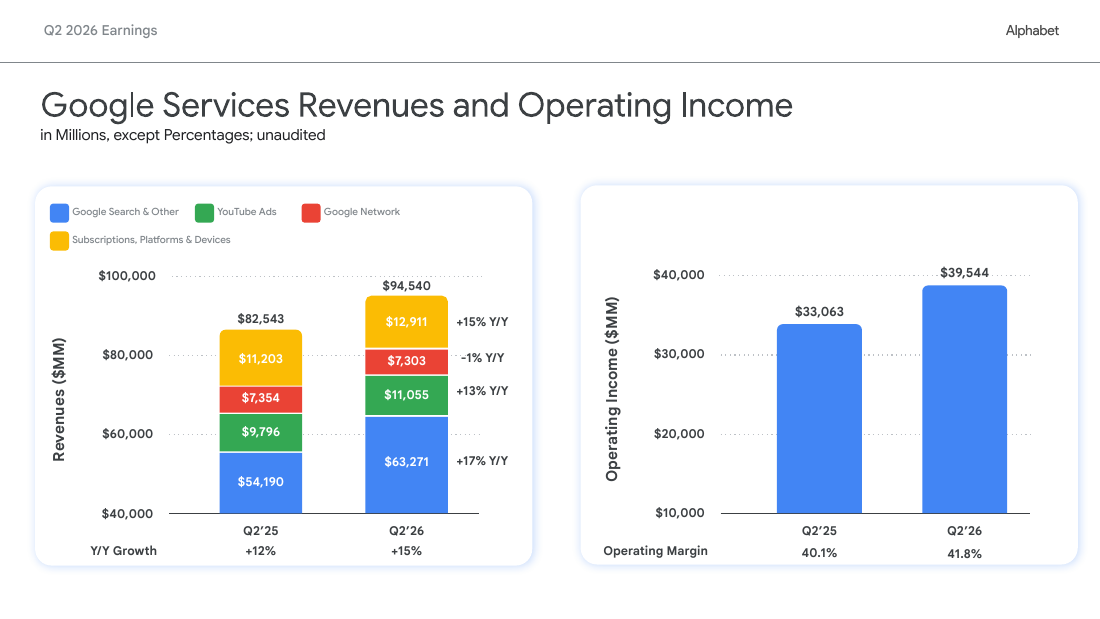
Google Services generated $94.5bn of Q2 revenue and $39.5bn of operating income. Search & other rose 17%, YouTube ads 13%, and subscriptions/platforms/devices 15%; Network fell 1%. Paid clicks rose 13% and CPC 3%, while Network impressions fell 12%. [E1] [E2]
Search & other
$63.3bn Q2 revenue. Model: commercial queries × monetized clicks × CPC, with growth fading from 13% in FY27 to 8% in FY31.
YouTube ads
$11.1bn Q2 revenue. Model: engagement × monetized impressions × yield; direct response leads brand advertising in the latest quarter.
Network
$7.3bn Q2 revenue. Model declines through FY31 because lower AdSense volume offsets pricing and AdMob support.
Subscriptions and devices
$12.9bn Q2 revenue. YouTube and Google One paid users support recurring revenue; hardware remains inside the disclosed residual.
AI Search is an economics question, not a feature-count question. The model does not award a separate Gemini uplift. Upside appears only if AI preserves intent, improves query frequency or increases advertiser value faster than serving cost.
Cloud and AI Infrastructure
Q2 Cloud revenue reached $24.8bn, up 82%; operating income was $8.8bn and margin 35.6%. Remaining performance obligations were approximately $519.5bn at June 30, while the issuer presentation cited a $514bn Cloud backlog. [E1] [E3]
Backlog is not revenue. Conversion depends on available compute, power, networking, customer deployment schedules and utilization. Our Cloud growth fades from 54% in FY27 to 18% by FY31, while margin rises from 37.0% to 41.5% as fixed infrastructure is absorbed.
USD bn. Revenue and operating income are shown as separate measures in the same quarter comparison.
| What to watch | Signal | Investment interpretation |
|---|---|---|
| Cloud margin | Holds above mid-30s | Utilization offsets infrastructure intensity |
| Depreciation | Grows slower than Cloud gross profit | Cash build converts into earnings |
| Backlog conversion | Revenue remains capacity-backed | Demand is durable rather than booked optionality |
| Capex/revenue | Peaks before FY28 | FCFF recovery remains credible |
YouTube, Subscriptions and Ecosystem
YouTube connects a two-sided content market to Alphabet's advertising and subscription stack. Content providers supply inventory; users create watch time; advertisers fund monetization; YouTube Premium and TV subscriptions add recurring revenue. The digital twin captures the content-provider dependency because it affects revenue quality, cost of content and regulatory exposure.
Advertising engine
Q2 YouTube ad revenue rose 13% to $11.1bn, led by direct response and then brand advertising. We fade ad growth from 14% in FY27 to 9% in FY31. [E1]
Subscription engine
Subscriptions/platforms/devices rose 15% to $12.9bn, led by YouTube and Google One paid subscriptions. We model 16% growth in FY27, fading to 12% by FY31.
| Ecosystem node | Role | Revenue link | Key risk |
|---|---|---|---|
| Creators and media owners | Supply content and attention | Ad inventory and subscription value | Content cost and bargaining power |
| Advertisers | Monetize intent and reach | Auction yield and direct response | Macro budgets and measurement |
| Consumers | Generate engagement and paid users | Watch time, Premium and TV | Attention shifts and churn |
| Google Cloud / Gemini | Improve creation, recommendation and serving | Engagement and infrastructure demand | Serving cost and provenance |
YouTube is not valued separately in the target. Its economics are included in Google Services, where shared sales, infrastructure and recommendation systems make a clean stand-alone margin difficult to audit.
Other Bets and Waymo

Other Bets produced $382m of Q2 revenue and a $1.8bn operating loss, versus $373m and a $1.2bn loss a year earlier. It remains immaterial to consolidated revenue and material to losses. [E2]
Our model keeps Other Bets loss-making through FY31 and assigns no explicit Waymo value in the weighted valuation. This is conservative but evidence-led: operational scale can create upside, yet rider economics, fleet capital needs and stand-alone cash flow are not disclosed at the precision required for a target.
| Evidence needed before adding value | Why it matters |
|---|---|
| Rides, utilization and paid miles | Separates geographic expansion from economic density |
| Revenue per ride and contribution margin | Establishes unit economics |
| Fleet and remote-assistance cost | Defines capital intensity and operating leverage |
| External financing or strategic transaction | Provides an observable valuation reference |
Track Record
| Period | Revenue | Operating income | Net income | Diluted EPS | CFO | Capex | FCF |
|---|---|---|---|---|---|---|---|
| FY23 | 307.394 | 84.293 | 73.795 | $5.80 | 101.746 | 32.251 | 69.495 |
| FY24 | 350.018 | 112.390 | 100.118 | $8.04 | 125.299 | 52.535 | 72.764 |
| FY25 | 402.836 | 129.039 | 132.170 | $10.81 | 164.713 | 91.447 | 73.266 |
| Q1'26 | 109.896 | 39.696 | 62.578 | $5.11 | 45.790 | 35.674 | 10.116 |
| Q2'26 | 119.796 | 40.770 | 112.193 | $9.11 | 39.069 | 44.924 | -5.855 |
USD bn except per-share data. Quarterly cash flow is standalone; annual figures are full-year. [E1] [E4] [E10]
Revenue, USD bn.
Free cash flow, USD bn; FY versus standalone quarter.
Q2 EPS normalization
Reported Q2 EPS of $9.11 is not used for P/E valuation because unrealized portfolio marks dominate the quarter. The gain-specific tax rate is not disclosed; the 19.1% quarter tax rate is a transparent approximation. [E1]
How We Build the Forecast
Start with disclosed product revenue
Search, YouTube ads, Network, subscriptions/devices, Cloud and Other Bets are forecast separately.
Route operating drivers
Clicks and CPC inform Search; impressions and price inform Network; backlog and capacity inform Cloud.
Rebuild segment profit
Services and Cloud margins are applied separately; Other Bets and Alphabet-level costs remain explicit.
Translate earnings to cash
FCFF deducts capex and working capital after adding depreciation back to tax-affected EBIT.
Revenue = Search + YouTube ads + Network + Subscriptions/platforms/devices + Cloud + Other Bets + hedging
Operating income = Services revenue × Services margin + Cloud revenue × Cloud margin + Other Bets OI + Alphabet-level costs
Normalized EPS = [(operating income + recurring other income) × (1 − tax) − preferred dividends] ÷ diluted shares
FCFF = EBIT × (1 − tax) + D&A − capex − change in working capital
| Year | Services margin | Cloud margin | Tax | D&A | Capex | Diluted shares |
|---|---|---|---|---|---|---|
| 2026 | 43.0% | 36.0% | 18.5% | 38.0 | 180.0 | 12.27 |
| 2027 | 43.0% | 37.0% | 19.0% | 72.0 | 204.8 | 12.20 |
| 2028 | 43.2% | 38.0% | 19.0% | 110.0 | 213.7 | 12.14 |
| 2029 | 43.5% | 39.0% | 19.5% | 145.0 | 225.3 | 12.08 |
| 2030 | 43.8% | 40.0% | 19.5% | 168.0 | 239.0 | 12.02 |
| 2031 | 44.0% | 41.5% | 19.5% | 195.0 | 246.3 | 11.98 |
USD bn except percentages and diluted shares in billions. These are model assumptions, not company guidance.
Financial Forecasts
Revenue by disclosed product family
| Year | Search | YouTube ads | Network | Subscriptions / devices | Cloud | Other Bets | Total |
|---|---|---|---|---|---|---|---|
| 2026 | 258.4 | 44.0 | 28.3 | 54.4 | 108.8 | 1.7 | 495.6 |
| 2027 | 292.0 | 50.2 | 27.7 | 63.1 | 167.6 | 1.9 | 602.4 |
| 2028 | 324.1 | 56.2 | 26.9 | 71.9 | 231.2 | 2.1 | 712.5 |
| 2029 | 356.5 | 62.9 | 26.1 | 82.7 | 303.9 | 2.4 | 834.6 |
| 2030 | 388.6 | 69.2 | 25.3 | 93.5 | 376.9 | 2.6 | 956.1 |
| 2031 | 419.7 | 75.4 | 24.6 | 103.8 | 444.7 | 2.8 | 1071.0 |
USD bn. FY25 is the historical anchor; FY26–FY31 are estimates.
Consolidated forecast
| Year | Revenue | Operating income | Operating margin | Normalized EPS | Capex | FCFF |
|---|---|---|---|---|---|---|
| 2026 | 495.6 | 174.2 | 35.1% | $11.67 | 180.0 | -5.1 |
| 2027 | 602.4 | 215.7 | 35.8% | $14.33 | 204.8 | 35.9 |
| 2028 | 712.5 | 260.8 | 36.6% | $17.41 | 213.7 | 100.6 |
| 2029 | 834.6 | 312.8 | 37.5% | $20.86 | 225.3 | 163.5 |
| 2030 | 956.1 | 366.3 | 38.3% | $24.54 | 239.0 | 214.9 |
| 2031 | 1071.0 | 420.4 | 39.3% | $28.26 | 246.3 | 277.1 |
Forecast revenue, USD bn.
Forecast FCFF, USD bn. FY26 remains negative during the infrastructure build.
The forecast is deliberately conservative on cash. It allows Cloud growth and margin to rise while keeping consolidated FCFF negative in FY26, because capex is paid before revenue and depreciation mature.
Valuation
FY27E EPS $14.33 × 26×
9.75% WACC; 3.0% terminal growth
-8.8% versus reference price
| DCF bridge | USD bn |
|---|---|
| PV of explicit FCFF | 507.5 |
| PV of terminal value | 2419.6 |
| Enterprise value | 2927.1 |
| Add: cash and marketable securities | 242.5 |
| Less: official current and non-current debt | (100.2) |
| Less: preferred capital | (20.0) |
| Equity value | 3049.4 |
| Period-end common shares | 12.230bn |
| DCF value per share | $249 |
DCF sensitivity
| WACC / terminal growth | 2.5% | 3.0% | 3.5% |
|---|---|---|---|
| 9.00% | $266 | $285 | $307 |
| 9.75% | $235 | $249 | $266 |
| 10.50% | $210 | $221 | $234 |
The P/E and DCF answers differ by 49%. The P/E rewards durable earnings and platform quality; the DCF penalizes near-term infrastructure spending. Until cash conversion narrows that gap, a point target would imply more precision than the evidence supports.
Scenarios, Catalysts and Risks
| Scenario | Search growth | Cloud growth | Cloud terminal margin | Capex / revenue | Value indication |
|---|---|---|---|---|---|
| Bear | 5–7% | 18–23% | 27–30% | 39–42% peak | $225 |
| Base | 9–11% | 26–31% | 34–37% | 35–38% peak | $311 |
| Bull | 12–14% | 33–38% | 39–42% | 32–35% peak | $423 |
Near-term catalysts
- Cloud backlog conversion with margin holding above the mid-30s.
- Search growth and CPC resilience as AI features scale.
- Capex growth peaking before depreciation pressure becomes dominant.
- Clearer Waymo utilization and unit economics.
Principal risks
- AI answers reduce commercial clicks or raise serving cost.
- Power, chips and networking delay Cloud deployment.
- Antitrust, DMA, privacy and AI remedies alter distribution or ad-tech design.
- Private-asset marks continue to distort GAAP EPS.
Search +17%, Cloud +82%, Cloud margin 35.6%, capex $44.9bn.
Approximately $1.5bn principal expense plus $581m interest and cost accrual; appealed.
Official financing update after the core evidence snapshot. [E5]
Watch Cloud revenue, margin, depreciation and capex together—not in isolation.
Capital Allocation and Governance
Alphabet entered the AI build with a formidable liquidity position. It also raised $49.6bn net proceeds in June for general corporate purposes including AI infrastructure and global compute, and closed another $25bn senior-notes offering on August 10. Gross issuance is initially matched by cash; debt is not deducted without the proceeds. [E1] [E5]
| Allocation question | Current evidence | What shareholders should watch |
|---|---|---|
| Infrastructure | $44.9bn Q2 capex; six-month capex $80.6bn | Utilization, depreciation and power commitments |
| Repurchases | $69.5bn remaining authorization | Whether buybacks offset dilution at attractive prices |
| Preferred capital | $20bn provisional deduction in DCF | Conversion economics and future diluted shares |
| Legal and regulatory | $17.4bn accrued fines and settlements | Cash cost and business-model remedies |
| Other Bets | $1.8bn Q2 operating loss | Milestones tied to externally observable economics |
The balance sheet lowers financing risk; it does not remove return-on-capital risk. The relevant test is the spread between the earnings produced by new capacity and its cash, depreciation and financing burden.
Sources, Methods and Disclosures
Evidence hierarchy
SEC filings and issuer financial materials anchor reported results. Official product and subsidiary materials support operating context and images. Provider snapshots are used only for the reference price and an external estimate cross-check. Forward estimates, scenarios and valuation assumptions are our calculations.
| ID | Document | Owner | Published / snapshot | Link | Use |
|---|---|---|---|---|---|
| E1 | Alphabet Q2 2026 Form 10-Q | SEC | 2026-07-23 | Open source | Authoritative |
| E2 | Alphabet Q2 2026 earnings release | Alphabet / SEC | 2026-07-23 | Open source | Authoritative |
| E3 | Alphabet Q2 2026 earnings slides | Alphabet IR | 2026-07-22 | Open source | Authoritative issuer material |
| E4 | Alphabet 2025 Form 10-K | SEC | 2026-02-05 | Open source | Authoritative |
| E5 | Alphabet August 2026 senior-notes 8-K | SEC | 2026-08-10 | Open source | Authoritative financing update |
| E6 | GOOG annual analyst estimates snapshot | FMP | 2026-08-12 | Open source | Supporting; provider-native |
| E7 | GOOG profile and cutoff-price snapshot | FMP | 2026-08-12 | Open source | Supporting; provider-native |
| E8 | Waymo media resources | Waymo | 2026-08-13 | Open source | Official issuer-controlled material |
| E9 | Google Cloud TPU platform | Google Cloud | 2026-08-13 | Open source | Official product material |
| E10 | Alphabet SEC Companyfacts | SEC | 2026-08-12 | Open source | Authoritative structured facts |
Methods and limitations
- Quarterly cash-flow data are standalone; six-month figures are not substituted for a quarter.
- GAAP EPS remains visible, but the valuation uses normalized earnings after removing the disclosed equity-security gain.
- Backlog and adoption KPIs inform operating judgment; neither is recognized as revenue.
- Weighted-average diluted shares are used for EPS and period-end common shares for DCF per-share value.
- Preferred capital is deducted at $20bn pending full conversion economics; scenario values are not probability-weighted targets.
- Waymo contributes no explicit value to the weighted indication.
This research is for information and discussion only and is not investment advice or an offer to transact. Forecasts and valuations are uncertain and may differ materially from actual outcomes. Investors should assess suitability, liquidity, taxes and risk independently.