BlackBuck Limited

Initiation of coverage

BlackBuck Limited

Scale is proven; monetisation quality is the next test

BLACKBUCK.INNSE / BSEDigital trucking platform and commercial-vehicle services2026-07-30
Evidence-backed research POC. Model indication: HOLD; target INR 505. Rating pending analyst approval.

Contents

Research cut 2026-07-30T23:59:59+05:30. Report figures are model outputs unless explicitly labelled reported or preliminary.

01

Investment Summary

Scale is proven; monetisation quality is the next test

RatingHOLD
Target priceINR 505
Reference priceINR 546
Implied return-7.5%

BlackBuck has moved from user acquisition to profitable platform monetisation. Payments remains the anchor, while telematics, freight matching and vehicle finance expand revenue per operator. The investment case now rests on sustained transaction growth, cross-sell and disciplined credit economics rather than platform reach alone.

What matters

Payments supplies frequency; cross-sell supplies the upside

FASTag and fuel transactions keep operators active, but the larger earnings opportunity is selling telematics, freight and finance to the same customer base. Revenue per operator and contribution margin therefore matter more than registered users alone.

BlackBuck Annual Report FY2024-25

Profitability has inflected, but the comparison base is messy

FY2026 PAT reached INR 1,603m after FY2025 was distorted by IPO and share-based-payment exceptional items. We anchor the forecast to current operating margins and segment economics rather than treating the reported GAAP swing as a repeatable growth rate.

BlackBuck FY2026 audited consolidated results

Policy and partner concentration remain material

Electronic tolling rules determine product architecture, while one FASTag partner bank previously represented roughly one-third of revenue. GNSS transition or partner repricing can affect volumes, fees and migration cost even if aggregate tolling continues to grow.

BlackBuck Red Herring Prospectus

The share price already discounts a strong execution path

Our base valuation requires sustained revenue growth, continued margin expansion and a premium FY2028 earnings multiple. That leaves limited room for a weak cross-sell or credit-quality outcome.

Derived model output

Share-price history01903795697582025-012025-032025-042025-062025-072025-092025-102025-122026-012026-032026-042026-062026-072026-07Share price
Reference-price history. The valuation date is fixed; subsequent prices are not included.
PeriodRevenueGrowthEBITDA marginEPS
FY2027INR 8,800.0m35.0%28.0%10.49
FY2028INR 11,700.0m33.0%30.0%15.41
FY2029INR 14,600.0m24.8%31.5%20.19

The rating is a model indication pending analyst approval. It is not personalized investment advice.

02

Thesis and Variant View

The variant view is about conversion, not the existence of demand.

Payments supplies frequency; cross-sell supplies the upside

FASTag and fuel transactions keep operators active, but the larger earnings opportunity is selling telematics, freight and finance to the same customer base. Revenue per operator and contribution margin therefore matter more than registered users alone.

Profitability has inflected, but the comparison base is messy

FY2026 PAT reached INR 1,603m after FY2025 was distorted by IPO and share-based-payment exceptional items. We anchor the forecast to current operating margins and segment economics rather than treating the reported GAAP swing as a repeatable growth rate.

Policy and partner concentration remain material

Electronic tolling rules determine product architecture, while one FASTag partner bank previously represented roughly one-third of revenue. GNSS transition or partner repricing can affect volumes, fees and migration cost even if aggregate tolling continues to grow.

The share price already discounts a strong execution path

Our base valuation requires sustained revenue growth, continued margin expansion and a premium FY2028 earnings multiple. That leaves limited room for a weak cross-sell or credit-quality outcome.

03

Business Model

BlackBuck operates a digital platform for Indian truck operators and fleet owners. Its app combines electronic tolling and fuel payments, GPS telematics, a loads marketplace and commercial-vehicle financing, supported by field distribution and regulated subsidiaries.

Business lineWhat it doesPrimary earnings driver
PaymentsFASTag tolling and fuel-payment products used by commercial-vehicle operators.Payment GTV, transaction count, active tags and partner take rates
TelematicsGPS hardware and fleet-management services providing location and operating visibility.Monthly active devices, ARPU, retention and service cost
Loads MarketplaceDigital freight matching between shippers and truck operators.Posted loads, marketplace liquidity, match rate and monetisation
Vehicle FinancingUsed commercial-vehicle credit through a regulated subsidiary and financial partners.Disbursements, loan yield, funding cost, collections and credit loss
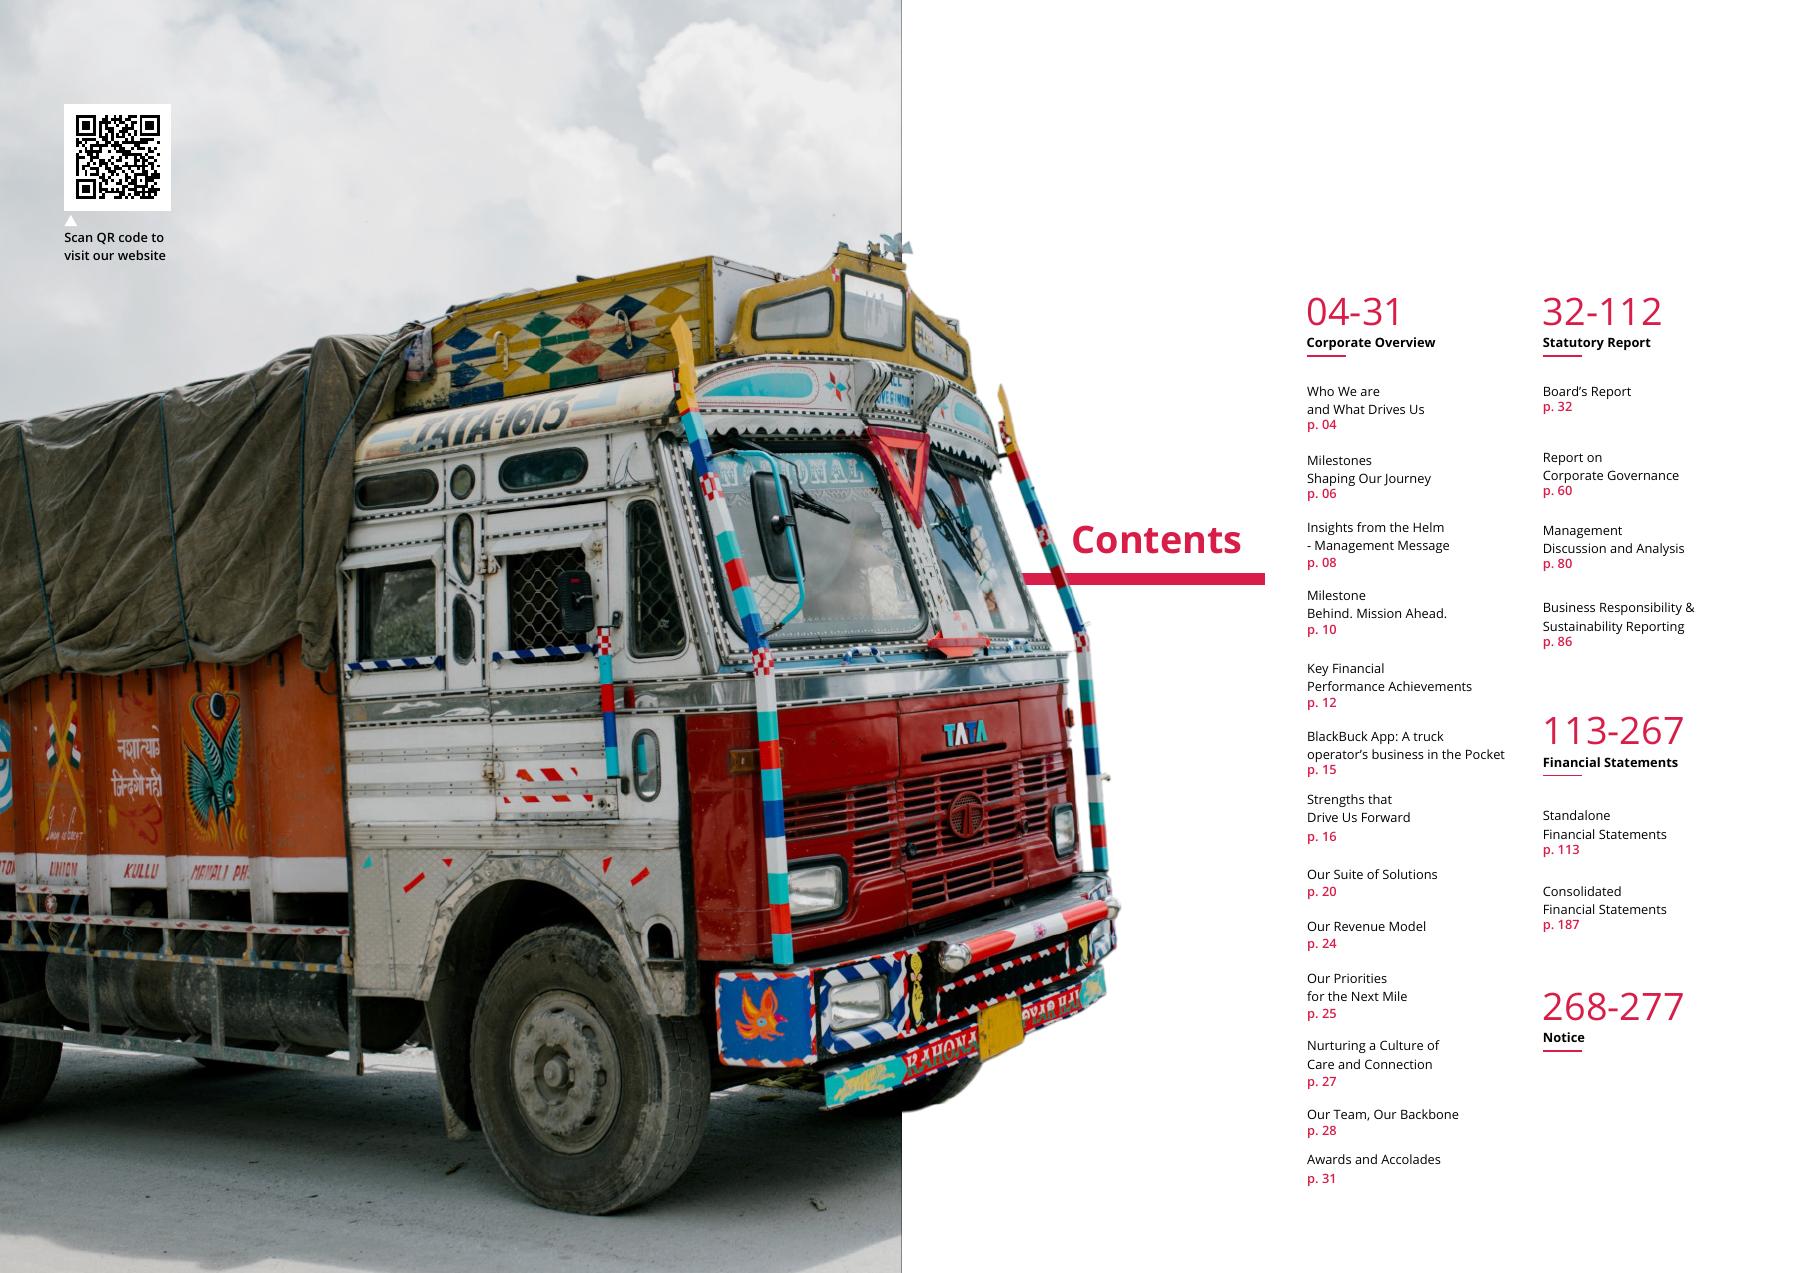
Truck-operator market and company-report contents
Truck-operator market and company-report contents. Source: BlackBuck Annual Report FY2024-25, p. 3.
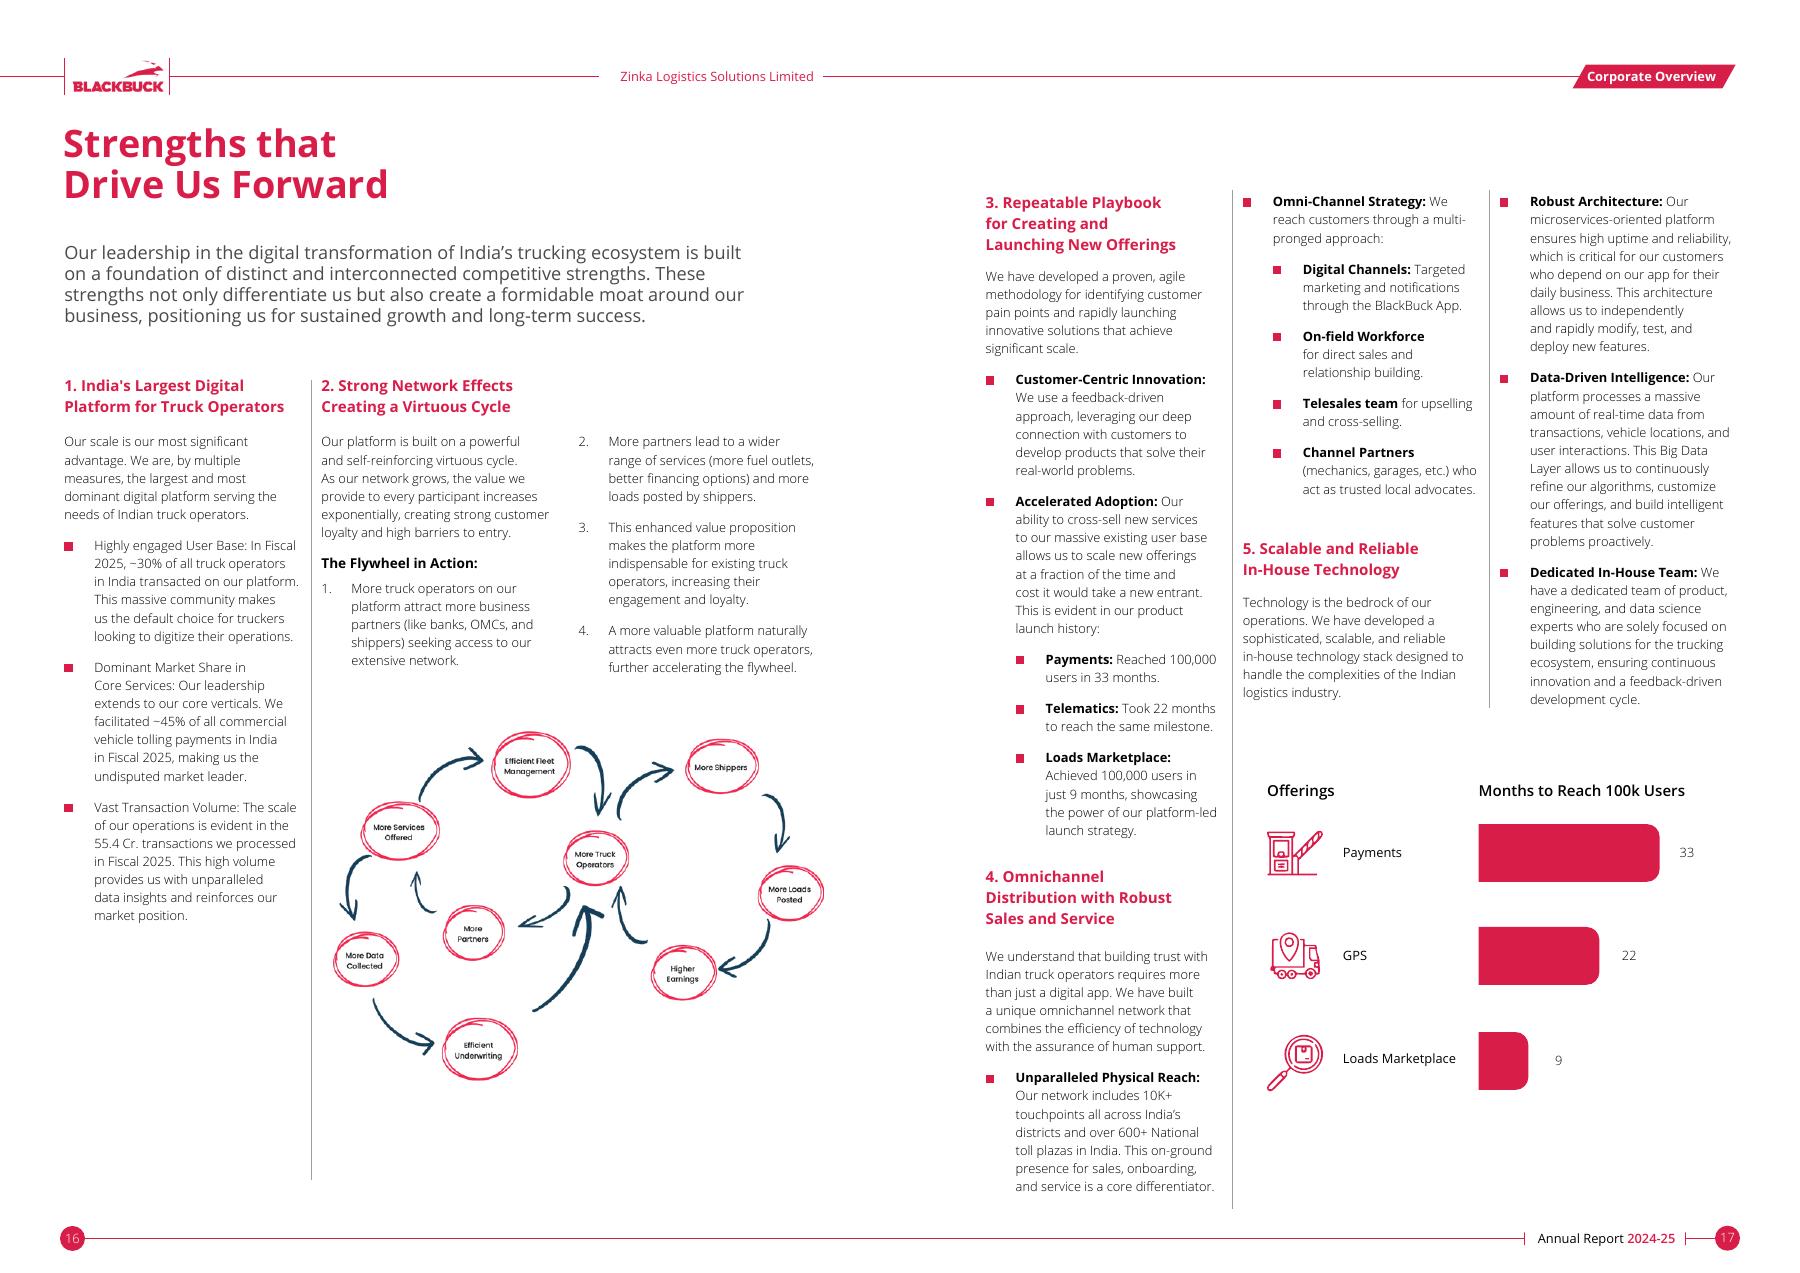
BlackBuck app and integrated service ecosystem
BlackBuck app and integrated service ecosystem. Source: BlackBuck Annual Report FY2024-25, p. 15.
04

Company Operating Map

A compact view of how products, capacity, counterparties and risks connect to the financial model.

Reviewed company operating mapBlackBuck App - Serves Customer Type - ShippersBlackBuck Limited - Operates Business - TelematicsPayments - Offers Product Or Platform - BlackBuck FASTagPayments - Outsources To Provider - FASTag partner banksBlackBuck Limited - Serves Customer Type - Truck operators and fleet ownersBlackBuck Limited - Exposed To Risk Factor - Credit riskBlackBuck App - Offers Product Or Platform - Vehicle FinancingBlackBuck Limited - Operates Business - Loads MarketplaceBlackBuck Limited - Has Business Driver - Payments transaction valueBlackBuck Limited - Has Business Driver - Transacting truck-operator growthVehicle Financing - Exposed To Policy - Reserve Bank of India lending regulationPayments - Offers Product Or Platform - BlackBuck Fuel CardsVehicle Financing - Outsources To Provider - Financial institution partnersVehicle Financing - Offers Product Or Platform - BlackBuck LoansBlackBuck Limited - Offers Product Or Platform - BlackBuck AppPayments - Outsources To Provider - Oil marketing company partnersBlackBuck Limited - Operates Business - PaymentsBlackBuck Limited - Exposed To Risk Factor - Payments-partner concentrationBlackBuck Limited - Reports Business Segment - Truck operator servicesBlackBuck App - Offers Product Or Platform - Loads MarketplaceBlackBuck Limited - Has Business Driver - Cross-selling across platform servicesBlackBuck Limited - Serves Customer Type - fleet operatorsBlackBuck App - Offers Product Or Platform - PaymentsBlackBuck Limited - Exposed To Risk Factor - GNSS tolling transitionLoads Marketplace - Serves Customer Type - ShippersBlackBuck Limited - Serves End Market - BlackBuck AppTelematics - Offers Product Or Platform - BlackBuck GPSPayments - Exposed To Policy - National Electronic Toll Collection and FASTag policyBlackBuck Limited - Operates Business - Vehicle FinancingBlackBuck33 nodes / 38 linksPaymentsVehicle FinancingLoads MarketplaceTruck operator servicesTelematicsBlackBuck AppBlackBuck FASTagBlackBuck Fuel CardsBlackBuck GPSBlackBuck LoansShippersTruck operators and fle...fleet operatorsFASTag partner banksFinancial institution p...Oil marketing company p...National Electronic Tol...Reserve Bank of India l...Cross-selling across pl...Payments transaction va...Transacting truck-opera...Credit riskGNSS tolling transitionPayments-partner concen...
Reviewed presentation graph. No relationship is inferred solely to increase density.
Driver to financial metric mapBusiness driversFinancial compartmentsForecast metricsTransacting truck-operator growthPayments transaction value and mo...Cross-selling across platform ser...Active telematics devices and ARPUVehicle-finance growth and credit...FASTag policy and payments-partne...RevenueRevenue per operatorContribution marginAdjusted EPSPayments revenueCustomer acquisition costTelematics revenueRevenueAdjusted EPSGAAP EPS
Driver paths describe a financial mechanism, not proven causality. Only reviewed driver-to-financial mappings enter the forecast; a graph connection alone never creates an earnings adjustment.
05

Industry and Demand

Indian road freight remains fragmented, creating scope for digital payments, telematics and freight matching to reduce operating friction for small fleets.

Electronic tolling is structurally established, but policy is not static. Multi-lane free flow and GNSS-based approaches can change the technology stack and partner economics.

Platform scale does not guarantee economic value. Retention, products per operator, take rate, support cost and credit quality determine whether transaction growth compounds into EPS.

Reviewed driver importance0%27%55%82%109%96.0%Transacting truck-93.0%Payments transacti88.0%Cross-selling acro82.0%Active telematics 79.0%Vehicle-finance gr77.0%FASTag policy and
Monitoring priorities derived from filings, operating disclosures and the reviewed company graph.
06

Products and Platform

Product or marketRoleWhy it matters
Loads MarketplaceDigital freight marketplaceMarketplace liquidity, posted loads, match rates and user trust determine whether it becomes a durable transaction and engagement channel.
PaymentsTolling and fuel-payment businessGross transaction value, active users and partner economics determine fee revenue, while the frequency of payments helps keep operators engaged with the wider platform.
TelematicsFleet visibility and vehicle-tracking businessMonthly active devices and retention influence recurring revenue and create operating data that can support payments, freight matching and credit decisions.
Vehicle FinancingCommercial-vehicle financing businessLoan disbursements deepen customer relationships, but funding cost, underwriting quality, collections and regulation determine the risk-adjusted return.
second-hand commercial vehiclesEnd marketDemand, technology cycles, customer investment, regulation, and competitive intensity in this market can affect orders, mix, utilization, and revenue growth.
The Indian trucking industryEnd marketDemand, technology cycles, customer investment, regulation, and competitive intensity in this market can affect orders, mix, utilization, and revenue growth.
BlackBuck AppUnified truck-operator platformA common interface lowers distribution cost and supports cross-selling; engagement, reliability and products used per operator are therefore important platform-health indicators.
BlackBuck FASTagCommercial-vehicle tolling productActive tags and toll transactions support recurring platform activity and can create a distribution point for other BlackBuck services.
BlackBuck Fuel CardsFleet fuel-benefits productAcceptance coverage, fuel throughput, partner economics and repeat usage determine revenue contribution and customer retention.
BlackBuck GPSFleet tracking and telematics productInstalled and active devices create subscription-like usage, improve operator engagement and generate data that can support other services.
BlackBuck LoansTechnology-led vehicle-finance productLoan originations can deepen operator relationships, but asset quality, funding cost and regulatory compliance are critical to sustainable returns.
Lending businessCommercial-vehicle finance segmentDisbursements, funding cost, credit quality, collections and regulatory capital determine the segment's earnings and risk.
Truck operator servicesDigital trucking-services segmentGrowth depends on active trucks, product adoption, transaction volume, retention and the company's ability to cross-sell several services to the same operator.
BlackBuck app and integrated service ecosystem
BlackBuck app and integrated service ecosystem. BlackBuck Annual Report FY2024-25.
07

Customers, Partners and Routes to Market

Public disclosures support customer types, channels and selected counterparties; they do not support a complete customer roster or private contract economics.

RelationshipRoleCompany relevance
fleet operatorsUnnamed customer categoryThe category provides useful demand and product context, but it must not be converted into a named-customer claim without separate evidence.
ShippersFreight-demand customer groupA broad, repeat shipper base improves load availability and makes the marketplace more useful to truck operators.
Truck operators and fleet ownersPrimary operating customer groupThe number of transacting operators, products used per operator and retention are central measures of platform depth.
BengaluruOperating geographyOperations in this geography can create exposure to local demand, regulation, currency, labor, tax, political conditions, and execution risk.
IndiaGeographyDemand, currency, regulation, trade policy, public spending, and economic conditions in this geography may affect revenue growth, margins, cash collection, and reported results. Operations in this geography can create exposure to local demand, regulation, currency, labor, tax, political conditions, and execution risk.
Company-described network effects and distribution model
Company-described network effects and distribution model. BlackBuck Annual Report FY2024-25.
08

Technology, Distribution and Funding

Asset, input or providerRoleOperational significance
FASTag partner banksBanking partners for electronic tollingThese relationships provide access to the national tolling network. Pricing, service continuity or partner concentration can affect tolling volumes and payment revenue.
Financial institution partnersVehicle-credit funding and origination partnersCredit appetite, pricing, approval rates and funding availability constrain how quickly vehicle financing can grow.
Oil marketing company partnersFuel-network partnersNetwork reach, discount economics and continuity of partner arrangements determine fuel-card adoption, transaction value and customer utility.
09

Historical Financials

PeriodRevenueEBITDANet incomeEPS
FY2024INR 2,969.2mINR -1,669.1mINR -1,939.5m-10.52
FY2025INR 4,267.3mINR 908.7mINR -86.5m-0.53
FY2026INR 6,519.7mINR 1,901.3mINR 1,603.4m8.76
Revenue history and forecast05,50011,00016,50022,000FY24FY25FY26FY27FY28FY29FY30FY31Revenue
Solid line combines reported history and analyst forecasts; the boundary is identified in the table and methodology.
EPS history and forecast-101112132FY24FY25FY26FY27FY28FY29FY30FY31EPS
Per-share history follows the stated share basis in the source records.
10

Forecast Framework

A statistical control and a separate analyst driver model are kept visible.

Revenue = demand x addressable exposure x order conversion x capacity realizationEBITDA = Revenue x EBITDA marginEPS = Net income / diluted sharesFCFF = EBIT x (1 - tax) + D&A - capex - change in working capital

Point-in-time control model

MetricSelected modelPeriodsWAPEBiasInterval coverage
GAAP diluted EPSrobust_ensemble320.8%-20.1%66.7%
Net incomerobust_ensemble328.9%3.0%33.3%
Revenuerobust_theil_sen32.9%-2.9%100.0%

The control is selected through expanding-window backtesting. Small samples make these diagnostics descriptive rather than conclusive. The annual analyst case uses operating evidence and does not overwrite the frozen control.

Annual assumption bridge

YearRevenue growthEBITDA marginNet marginCapex / revenueBasis
FY202735.0%28.0%22.0%7.0%FY2027 Q1 run-rate, operator and payments growth, with no automatic event uplift
FY202833.0%30.0%24.5%6.0%Cross-sell, telematics scale and stronger fixed-cost absorption
FY202924.8%31.5%26.0%5.0%Broader platform monetisation with credit losses held within normalised assumptions
FY203019.9%32.5%27.0%4.0%Maturing transaction platform and moderating growth
FY203114.3%33.0%27.5%4.0%Steady-state growth with continued technology and distribution investment
11

Financial Forecasts

YearRevenueEBITDAEBITNet incomeEPSFCFF
FY2027INR 8,800.0mINR 2,464.0mINR 1,936.0mINR 1,936.0m10.49INR 1,012.0m
FY2028INR 11,700.0mINR 3,510.0mINR 2,808.0mINR 2,866.5m15.41INR 1,638.0m
FY2029INR 14,600.0mINR 4,599.0mINR 3,796.0mINR 3,796.0m20.19INR 2,409.0m
FY2030INR 17,500.0mINR 5,687.5mINR 4,812.5mINR 4,725.0m25.00INR 3,259.4m
FY2031INR 20,000.0mINR 6,600.0mINR 5,600.0mINR 5,500.0m28.80INR 3,800.0m
Revenue history and forecast05,50011,00016,50022,000FY24FY25FY26FY27FY28FY29FY30FY31Revenue
Revenue forecast with the research-cut boundary disclosed in the table.
Forecast margins0%9%18%27%36%FY27FY28FY29FY30FY31EBITDA marginNet margin
Margins are not held at a peak indefinitely; the model allows normalization as industry capacity expands.

EPS follows modeled net income and diluted shares without a manual override; the full series is shown in the table above.

12

Valuation

The target blends a forward earnings multiple with a lower-weight DCF cross-check.

MethodKey assumptionValue per shareWeight
Forward P/EFY2028 EPS 15.41 at 35.0xINR 53990.0%
DCFWACC 13.5%; terminal growth 5.0%INR 21110.0%
Blended targetRounded under house policyINR 505100.0%

DCF sensitivity

WACC / g3.5%4.0%5.0%5.5%6.0%
12.0%INR 220INR 230INR 253INR 268INR 284
13.0%INR 198INR 206INR 223INR 234INR 246
13.5%INR 189INR 196INR 211INR 220INR 230
14.0%INR 181INR 187INR 200INR 208INR 217
15.0%INR 166INR 171INR 182INR 188INR 195

Scenarios

ScenarioProbabilityEPS factorP/ETargetReturnCase
Bear25.0%0.72x24.0xINR 265-51.2%Payments growth slows, partner economics weaken and lending credit cost rises.
Base55.0%1.00x35.0xINR 540-1.2%Operator growth and cross-sell support revenue while platform margins improve gradually.
Bull20.0%1.18x42.0xINR 76539.9%Faster multi-product adoption and strong transaction growth produce superior operating leverage.

DCF terminal value and the chosen P/E multiple are assumptions, not observed facts. The rating remains pending analyst approval.

13

Scenarios, Catalysts and Risks

Payments partner concentration

Medium probability / High impact. A partner-bank loss or repricing can interrupt issuance, reduce fee economics or require costly migration.

Valuation impact: A 10% FY2028 revenue shortfall and 27x P/E reduces indicated value materially below the reference price.

Mitigation: Multiple partner types, growing platform breadth and regulatory licences, although complete contract terms are private.

GNSS and tolling-policy transition

Medium probability / Medium-High impact. Technology migration can change transaction routing, product relevance, compliance work and implementation expense.

Valuation impact: A two-year delay in payments growth removes a large part of modeled operating leverage.

Mitigation: Existing user reach and field distribution may help migration, but this is not assured.

Vehicle-finance credit and funding

Medium probability / Medium impact. Faster lending growth raises income but also expected credit losses, collection cost and funding sensitivity.

Valuation impact: A 200 bp net-margin reduction lowers FY2028 EPS by roughly INR 1.25 per share.

Mitigation: Data-assisted underwriting, regulated subsidiary structure and financial-institution partners.

Valuation and execution

High probability / Medium impact. A premium multiple magnifies disappointment in operator growth, cross-sell or margin conversion.

Valuation impact: A 25x FY2028 P/E on base EPS implies value near INR 385 before DCF blending.

Mitigation: Net cash and recurring transaction activity provide support, but do not eliminate multiple risk.

Catalyst register

CatalystTimingEvidence to watchFinancial link
Sustained FY2027 quarterly growthQuarterlyRevenue, segment results and EPS against FY2027 Q1Revenue and operating leverage
Payments GTV and operator growthAnnual and operating updatesTransaction value, active operators and active FASTagsPayments revenue and contribution margin
Cross-sell evidenceMedium termProducts per operator, telematics devices and marketplace activityRevenue per operator and retention
Tolling-policy implementationOngoingNHAI rollout details and partner announcementsTransaction routing, fees and migration cost

Recent monitored events

DateEventDirectionImpact scoreForecast actionSource
2026-07-28BlackBuck Limited reports financial results for FY2027 Q1uncertain0.71baseline_revision_candidateBlackBuck Q1 FY2027 unaudited consolidated financial results
2026-07-22Government reports continued FASTag adoption and digital tolling activityuncertain0.48scenario_candidatePress Information Bureau / Ministry of Road Transport and Highways
2026-06-25NHAI starts Multi-Lane Free Flow tolling rollout at Gharaundauncertain0.26scenario_candidatePress Information Bureau / National Highways Authority of India
2026-05-18BlackBuck Limited reports financial results for FY2026 Q4uncertain0.71baseline_revision_candidateBlackBuck Q4 and FY2026 consolidated financial results
2026-04-15NHAI directs FASTag issuer banks to validate vehicle registration numbersmixed0.41monitorPress Information Bureau / National Highways Authority of India
2026-02-26NHAI considers fully digital payment at National Highway toll plazasuncertain0.35scenario_candidatePress Information Bureau / National Highways Authority of India
2026-02-04BlackBuck Limited reports financial results for FY2026 Q3uncertain0.71baseline_revision_candidateBlackBuck Q3 FY2026 consolidated financial results
2025-11-04BlackBuck Limited reports financial results for FY2026 Q2uncertain0.71baseline_revision_candidateBlackBuck Q2 FY2026 consolidated financial results
2025-08-04BlackBuck Limited reports financial results for FY2026 Q1uncertain0.71baseline_revision_candidateBlackBuck Q1 FY2026 consolidated financial results

Event paths are bounded monitoring scenarios. None of the listed market reactions is presented as proven causality.

14

Capital Allocation and Governance

Capital allocation

The model gives priority to balance-sheet capacity, reinvestment needs and cash conversion. Net cash is added in DCF, but only once; it is not also capitalized through the earnings multiple.

Expansion capex is explicitly deducted from FCFF in the year it is expected to be spent. A project can be strategically attractive and still reduce near-term free cash flow.

Governance stance

Reported actuals, research-cut dates, evidence hashes and approved ratings are outside the chatbot edit surface. Narrative and assumptions may change only through a validated, versioned patch.

Private contracts, complete customer rosters and undisclosed order economics remain unknown rather than estimated as facts.

Comparable-company screen

CompanyWhy includedHow used
PB FintechIndian digital financial platform comparablePlatform monetisation and premium-multiple context, not a direct product peer
IndiaMART InterMESHIndian marketplace comparableNetwork, customer acquisition and operating-leverage context
CE Info SystemsIndian location-data and mobility technology comparableTechnology and mobility exposure; business economics differ
DelhiveryListed Indian logistics technology operatorRoad-freight digitisation context; asset intensity is not comparable
15

Methodology, Sources and Disclosures

Evidence classes

Reported: official filing or exchange disclosure. Derived: deterministic calculation from reported figures. Forecast: model output using disclosed assumptions. Judgment: analyst interpretation. Scenario: bounded alternative, not a prediction.

Source ledger

SourceDateUseStatus
BlackBuck Annual Report FY2024-252025-07-11Audited financials, operating KPIs and platform descriptionavailable
BlackBuck FY2026 audited consolidated results2026-05-18FY2026 financial statements and segment resultsavailable
BlackBuck FY2027 Q1 unaudited consolidated results2026-07-28Latest reported quarteravailable
BlackBuck Red Herring Prospectus2024-11-06Business model, partner concentration and risk evidenceavailable
Government and NHAI digital tolling updates2026-07-22Electronic-tolling policy and adoptionavailable
Argus verified BlackBuck company-twin release2026-07-30Evidence-backed relationships, drivers and eventsavailable
Argus point-in-time statistical forecast run2026-07-30Frozen forecast control and backtestsavailable
Partner contracts, take rates and complete lending vintage dataKnown data gapknown_gap

Forecast governance

The point-in-time statistical baseline is frozen before event scenarios. Annual estimates use an explicit revenue-to-margin-to-EPS bridge. Events do not change the control forecast automatically; they create reviewable low/high deltas and require promotion into a new immutable version.

Limitations

  • Backtest histories are short and do not support strong claims of future accuracy.
  • Public disclosures do not reveal every customer, supplier, contract term or product-level margin.
  • Provider and extracted data are supporting evidence; official documents take precedence.
  • Valuation is sensitive to terminal growth, discount rates, multiples and the timing of operational assumptions.