Investment View
12 Aug 2026 close · [MP]
No approved target
Management guidance
16:26 IST
AI growth is visible; mix, accounting and concentration decide per-share conversion.
Broadcom's custom accelerators and Ethernet networking are delivering exceptional AI growth, while VMware provides a smaller but structurally higher-margin earnings engine. The investment question is whether concentrated AI programs convert into per-share cash earnings after mix, SBC, acquisition amortization, working capital, debt and contingent commitments. [E1] [E2] [E3] [MP]
What must go right
AI design wins must reach shipments while software conversion and cash economics absorb mix, amortization, SBC and debt.
What is priced imperfectly
Demand is visible; program timing, accounting conversion and concentrated dependencies are less transparent.
Why no rating
No approved annual forecast, backtest or canonical valuation assembly was available at the evidence cut.
Investment Summary
Broadcom's custom accelerators and Ethernet networking are delivering exceptional AI growth, while VMware provides a smaller but structurally higher-margin earnings engine. The investment question is whether concentrated AI programs convert into per-share cash earnings after mix, SBC, acquisition amortization, working capital, debt and contingent commitments.
| Q2 FY2026, US$bn except EPS | Q2 FY2025 | Q2 FY2026 | Basis |
|---|---|---|---|
| Revenue | 15.004 | 22.187 | +48% |
| Semiconductor Solutions | 8.408 | 15.009 | +79% |
| Infrastructure Software | 6.596 | 7.178 | +9% |
| GAAP net income | 4.965 | 9.310 | +88% |
| Adjusted EBITDA | 10.001 | 15.244 | 69% margin |
| Operating cash flow | 6.555 | 10.493 | +60% |
| Free cash flow | 6.411 | 10.262 | 46% margin |
GAAP and issuer-defined adjusted measures remain separately labelled.
Where Our View Differs
The core variant is mix and conversion. Semiconductor Solutions grew 79% but carried a 61.8% segment margin; Infrastructure Software grew 9% with a 78.7% segment margin. Faster AI mix can raise revenue while changing margin quality.
| Question | Current evidence | What would change the view |
|---|---|---|
| AI growth | $10.8bn Q2; $16bn Q3 guide | Program shipment and acceptance evidence |
| Semiconductor mix | 61.8% segment margin | Networking/XPU mix and cost |
| Software conversion | 78.7% segment margin; +9% revenue | VCF licence and renewal conversion |
| Unallocated expense | $4.140bn in Q2 | SBC, amortization and integration run-rate |
Broadcom System and Digital Twin
The operating map connects Broadcom's two segments with eleven products, six end markets, three ecosystem and commitment entities, and six business drivers. It maps reported operating relationships; it does not represent economic weight or allocate product-level revenue.
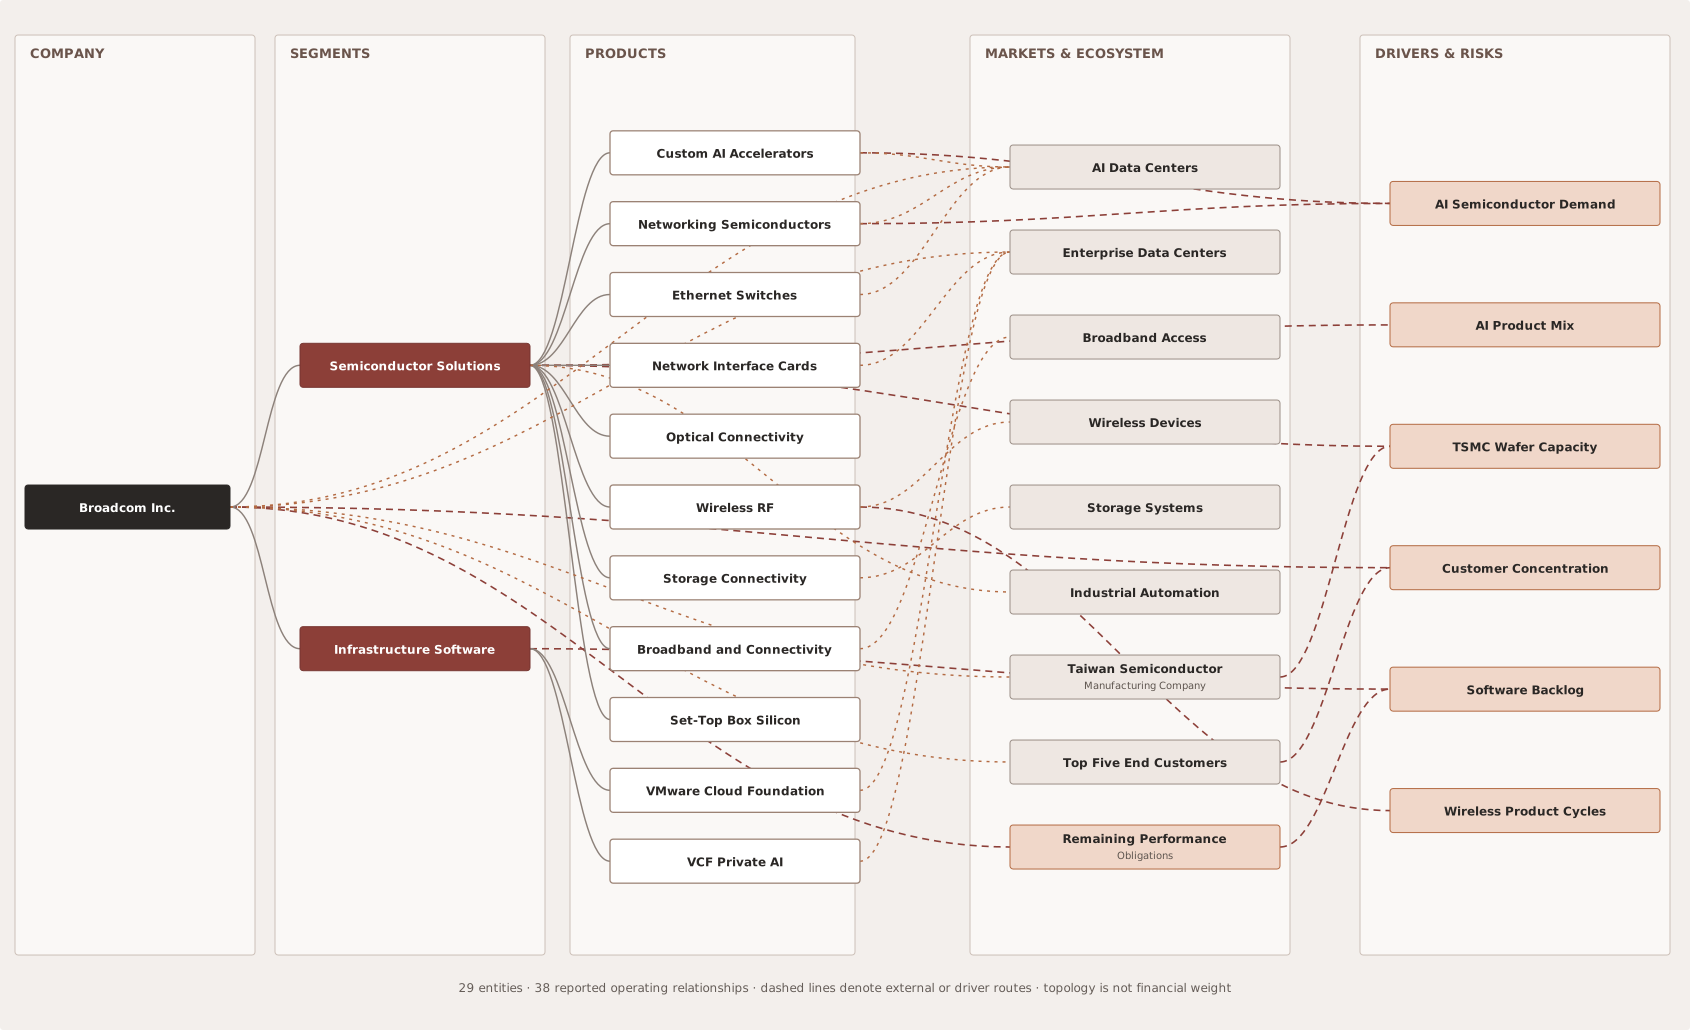
| Route | Relationship | Investment relevance |
|---|---|---|
| Broadcom → segments | Reports Semiconductor / Software | Two-engine earnings model |
| Semiconductor → products | Accelerators, networking, RF, storage, broadband | Revenue mix and cycle exposure |
| Products → markets | AI, enterprise, wireless, storage, broadband | Demand transmission |
| Broadcom → TSMC / top customers | External dependencies | Supply and concentration risk |
| Cross-segment RPO → revenue schedules | Unallocated contract evidence | Not recognized revenue |
Custom AI Accelerators
Q2 AI semiconductor revenue reached $10.8bn, up 143%, from custom accelerators and AI networking. Management guides Q3 to $16bn, over 200% growth. The issuer does not disclose XPU-only revenue or a Q3 GAAP profit bridge.
| Conversion gate | Evidence | Forecast boundary |
|---|---|---|
| Program demand | Long-term custom AI accelerator contracts | Not the same as shipment |
| Qualification | Customer design and acceptance | Timing can move quarterly revenue |
| Supply | Inventory $4.328bn; TSMC capacity dependency | Volume and working-capital gate |
| Recognized AI revenue | $10.8bn Q2 actual; $16bn Q3 guide | Includes custom accelerators + AI networking |
Ethernet, NICs and Optical Networking
Broadcom combines Ethernet switches, NICs, SerDes and optical connectivity across AI scale-up and scale-out. Product attachment can increase content per cluster, but the report assigns no unsupported product-level revenue.
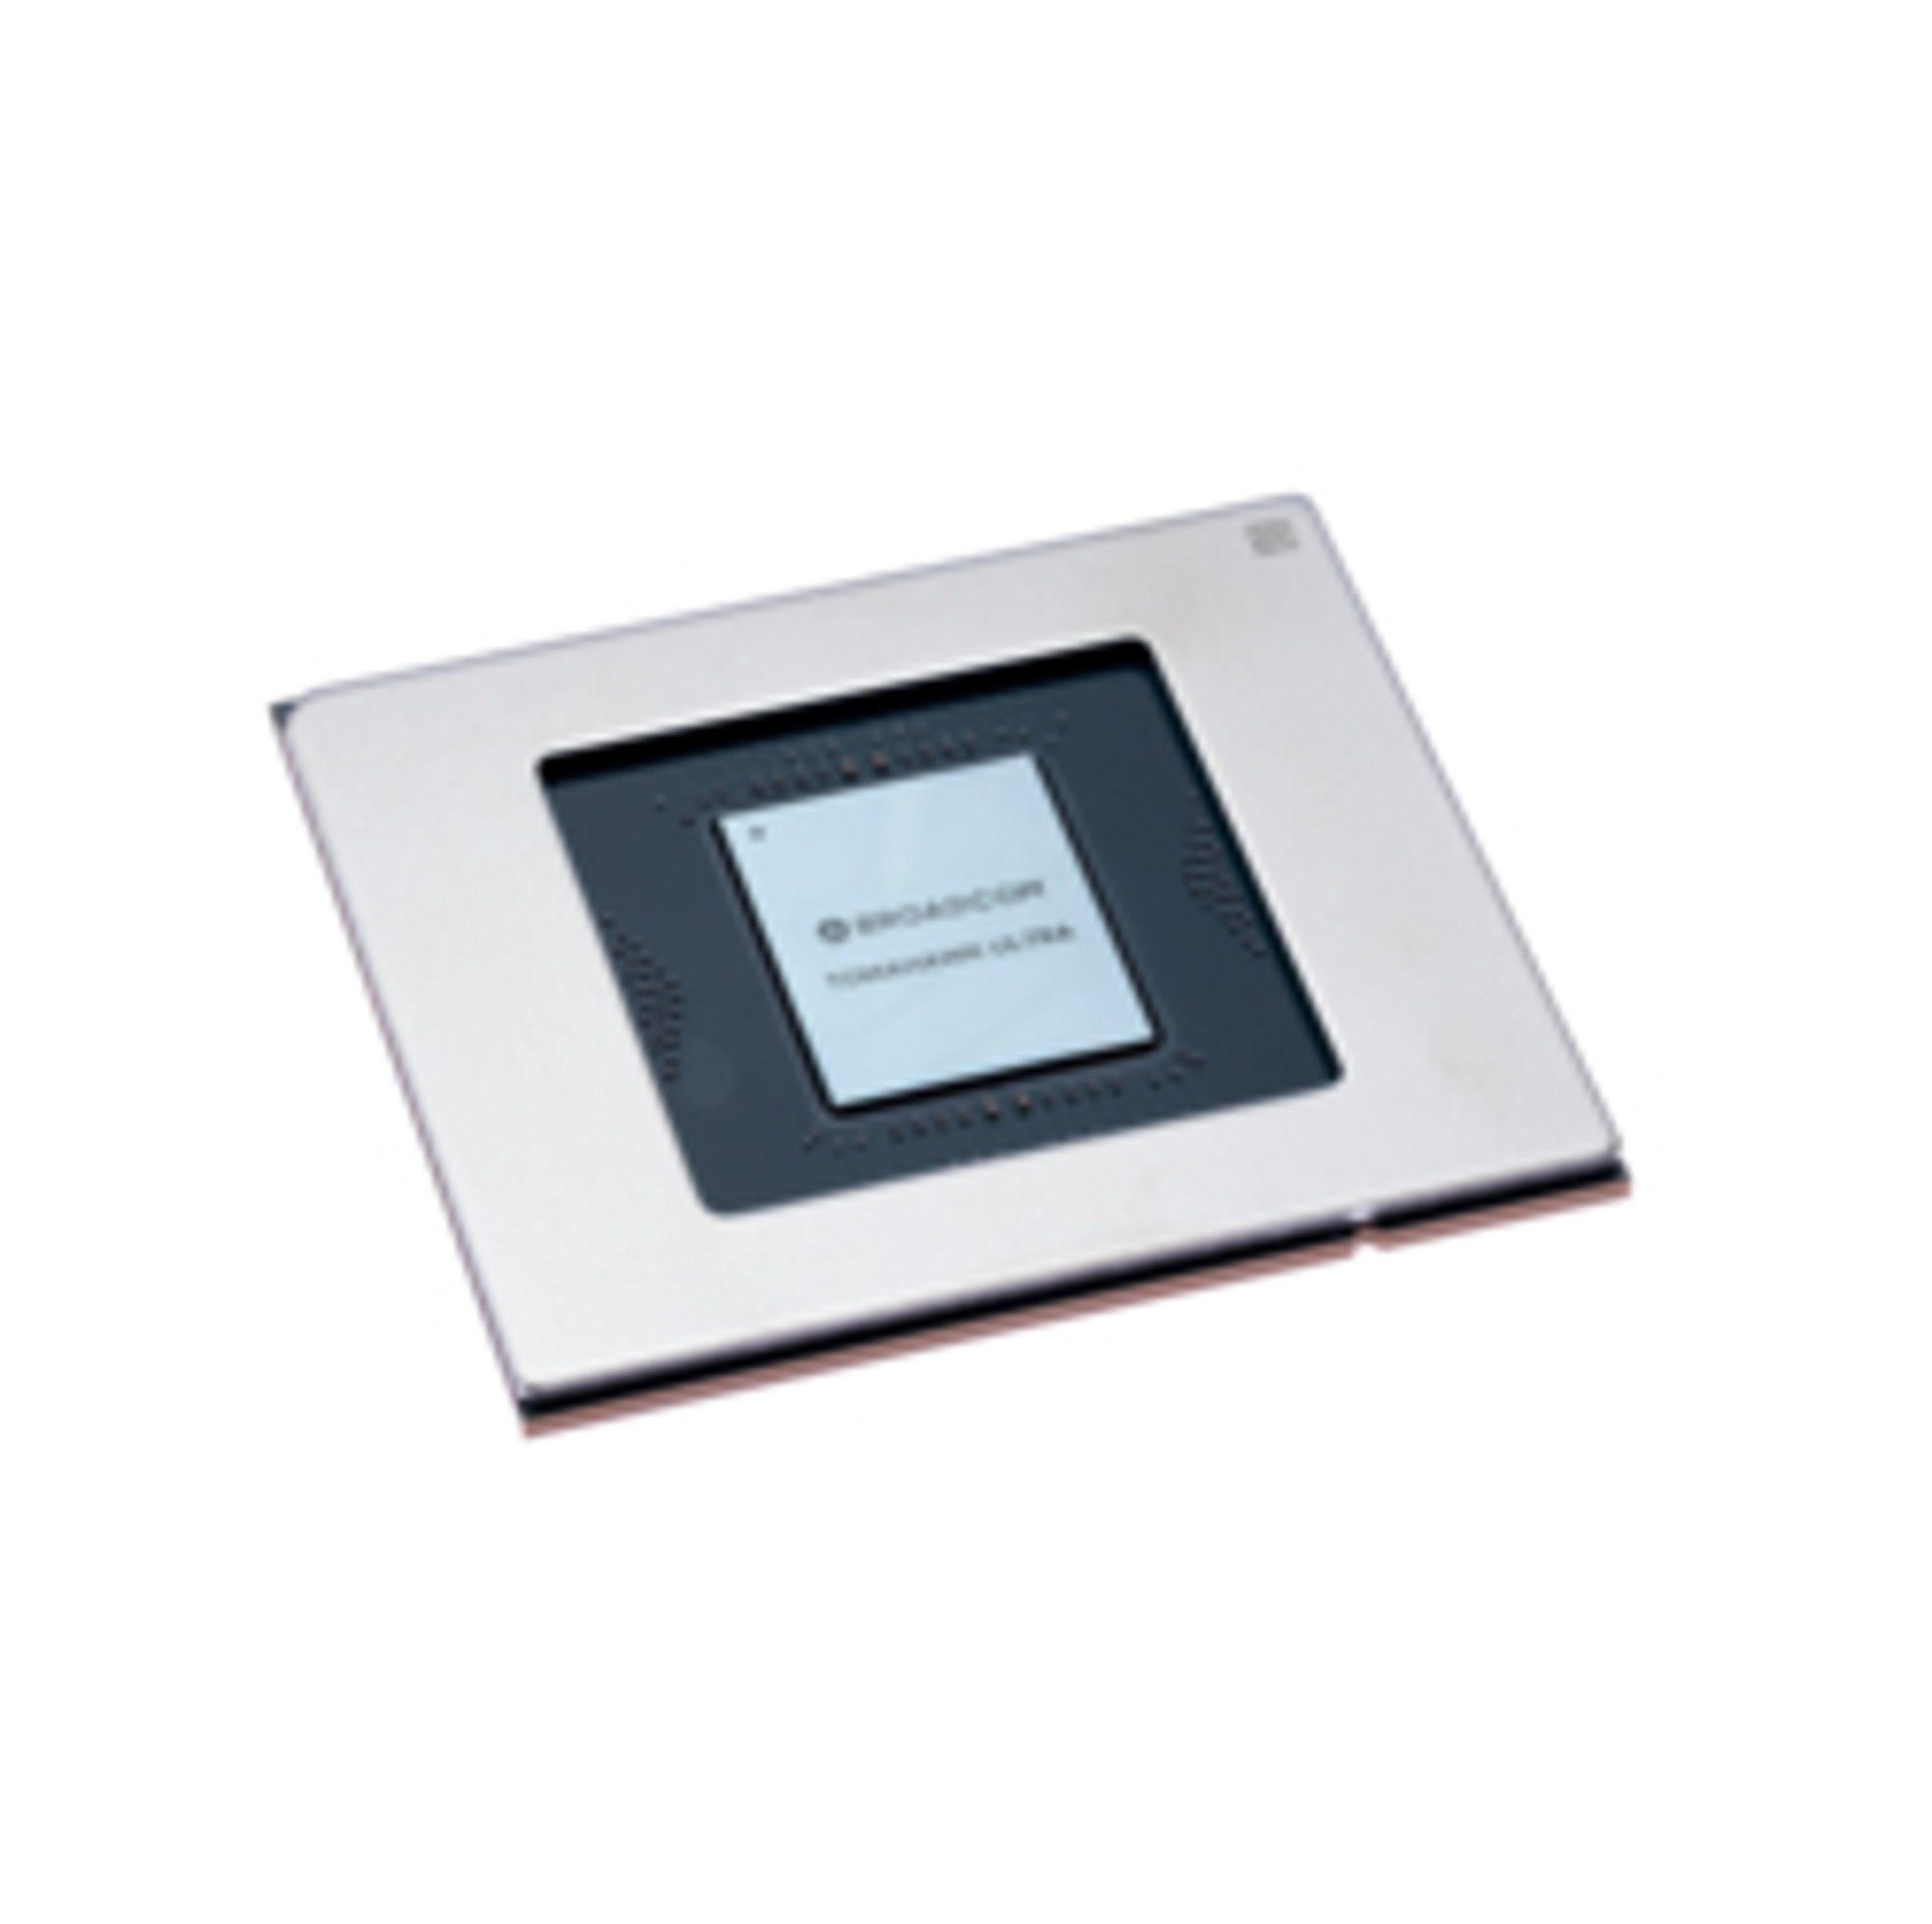
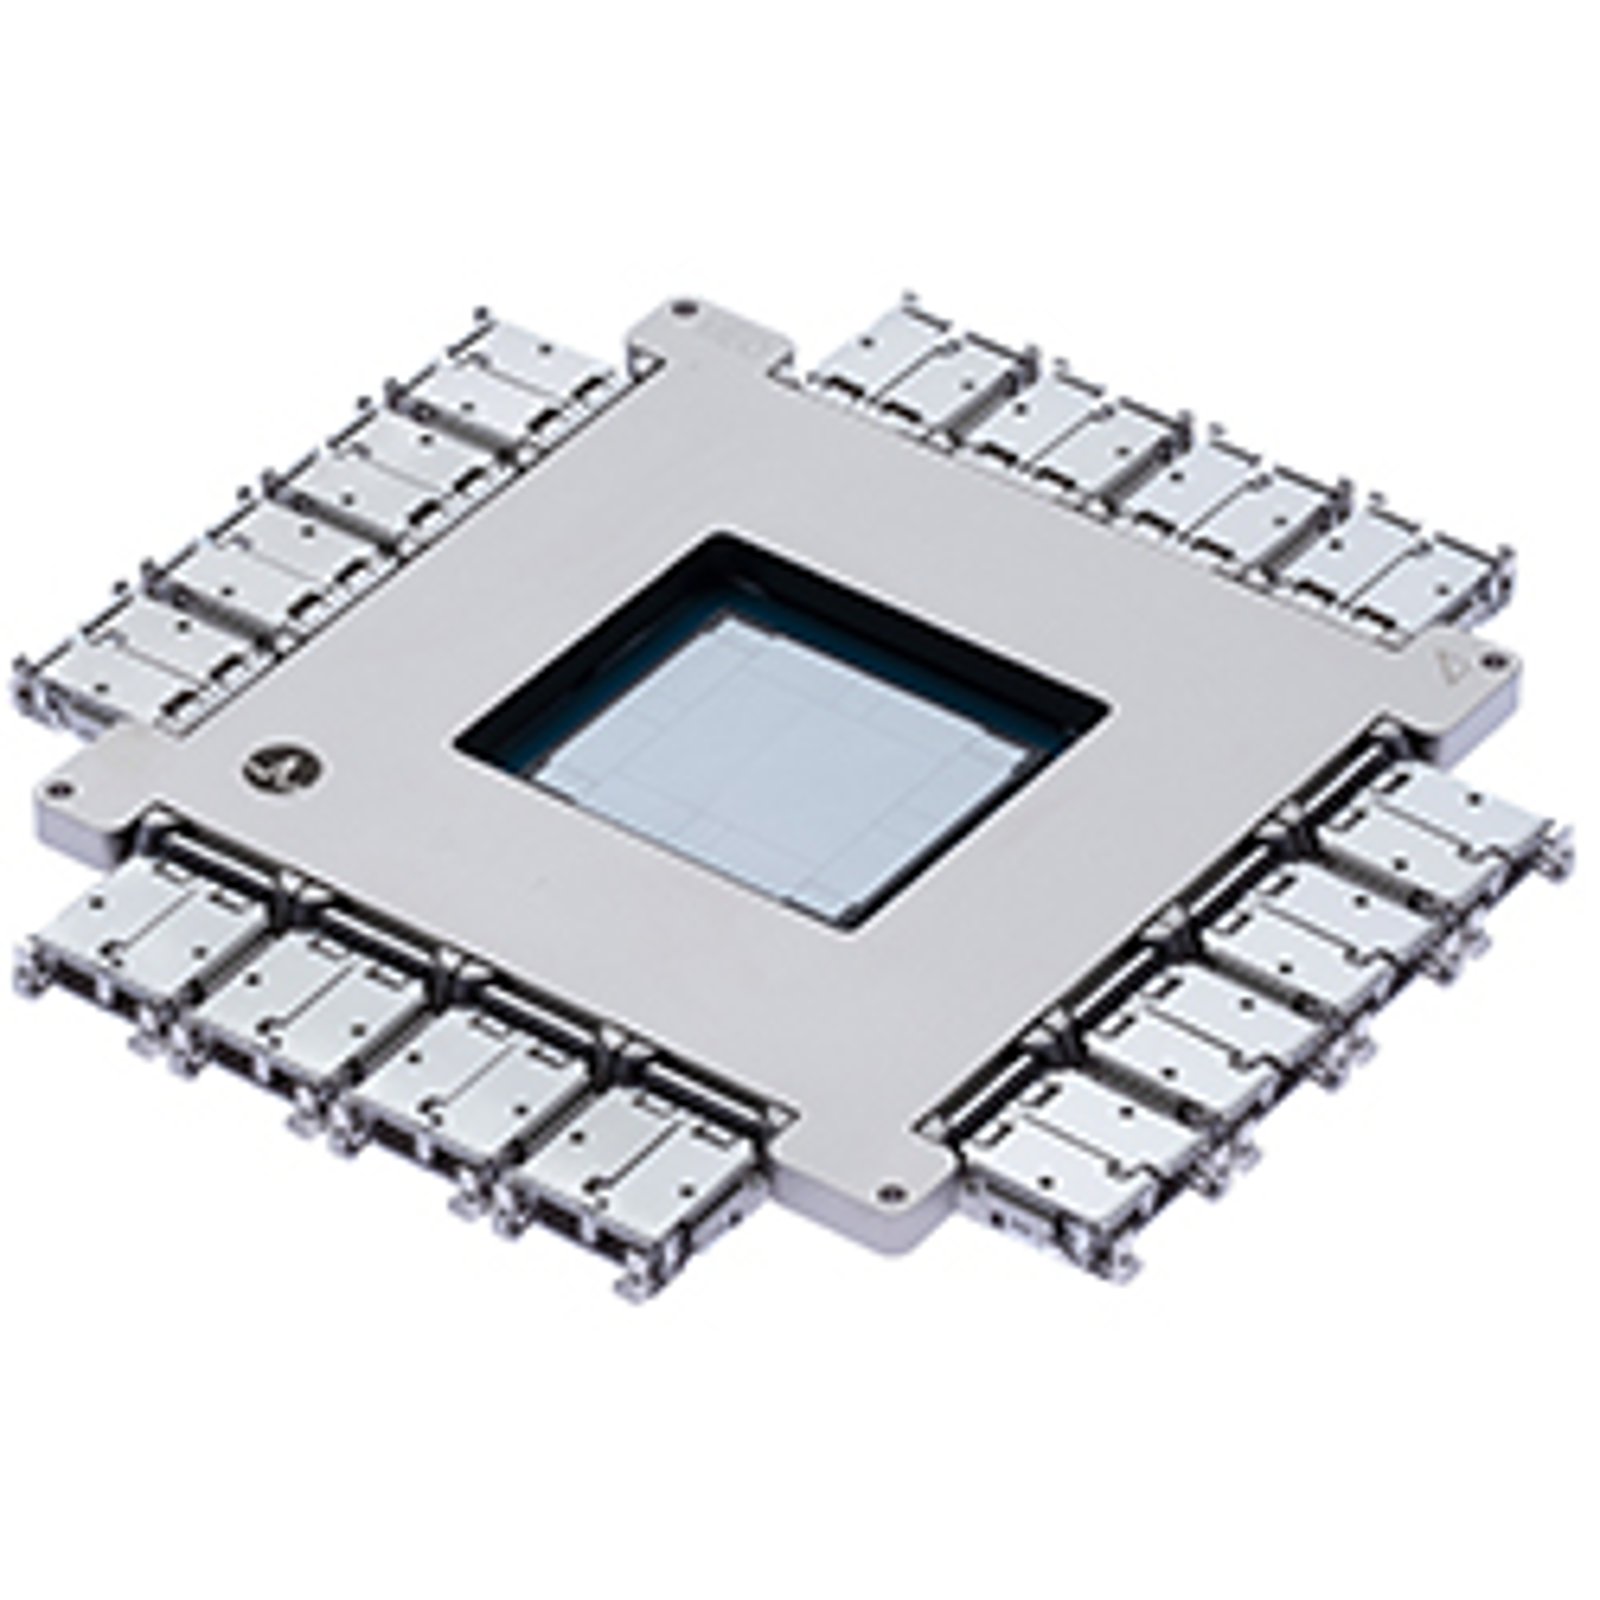
| Layer | Broadcom route | Economic question |
|---|---|---|
| Scale-up | Tomahawk Ultra / Ethernet | Latency and accelerator attachment |
| Scale-out | Ethernet switching and routing | Cluster size and content |
| Host connectivity | Network interface cards | Server / accelerator I/O |
| Optical | Davisson / co-packaged optics | Bandwidth, power and reach |
| Foundry | ~95% outsourced wafers from TSMC | Capacity, cost and geopolitics |
VMware and Infrastructure Software
Infrastructure Software is a smaller revenue engine with a higher segment margin. VMware Cloud Foundation conversion matters, but upfront licences, termination rights and cross-segment RPO prevent a simple recurring-revenue extrapolation.
| Evidence field | Current value | Boundary |
|---|---|---|
| Infrastructure Software revenue | $7.178bn Q2; +9% | Not a FY27 growth forecast |
| Segment operating margin | 78.7% | Before unallocated expense |
| Upfront licence revenue | $1.964bn Q2 | Timing differs from subscriptions |
| RPO | $164.6bn; ~30% expected in 12 months | Cross-segment; not indicative of future revenue |
| Contract liabilities | $14.242bn; 64% terminable | Recognition and cancellation risk |
Customers, Supply and Contract Commitments
Customer, distribution and foundry concentration are central to the risk case. The percentages below use different issuer-defined denominators and are not additive.
| Dependency | Current evidence | Transmission |
|---|---|---|
| Distributor | ~42% of Q2 and H1 revenue | Channel timing and counterparty |
| Top five end customers | ~45% of Q2 revenue | Program concentration |
| TSMC | ~95% of outsourced wafers | Supply, price and geopolitical risk |
| RPO | $164.6bn | Cross-segment commitments; not revenue |
| AI rack lease backstop | Up to $29bn maximum exposure | Contingent funding, not current debt |
Financial Record and Accounting
GAAP is the source-of-record basis. Acquisition amortization is shown separately; SBC remains visible as recurring compensation and dilution. Issuer non-GAAP measures are not substituted for GAAP earnings.
| Measure | Q2 FY2026 | Basis |
|---|---|---|
| Revenue | $22.187bn | GAAP |
| GAAP operating income | $10.788bn | GAAP |
| GAAP net income / diluted EPS | $9.310bn / $1.91 | GAAP; 4.876bn diluted shares |
| Non-GAAP operating income | $14.928bn | Issuer-defined |
| Non-GAAP net income / EPS | $12.074bn / $2.44 | Issuer-defined |
| CFO / capex / issuer FCF | $10.493bn / $0.231bn / $10.262bn | FCF is issuer-defined |
How We Build the Forecast
A defensible Broadcom forecast must be segment-driver-led, acquisition-accounting-aware and capital-structure-aware. The current input has no annual schedule, forward GAAP bridge or point-in-time backtest, so the report does not promote a model forecast.
| Required schedule | Why it matters | Current status |
|---|---|---|
| AI semiconductor / non-AI semiconductor | Separates disclosed AI guide from the rest of the segment | Missing |
| Infrastructure Software | Licences, renewals and terminations | Missing |
| Cross-segment RPO allocation | Separates semiconductor and software recognition | Missing |
| Unallocated operating expense | SBC, amortization and integration | Missing |
| Below operating income | Interest, other items and tax | Missing |
| Diluted shares | SBC and repurchases affect EPS | Missing |
| Backtest | Point-in-time Revenue/EPS error | Missing |
Guidance and Forecast Boundary
Management guides Q3 revenue to approximately $29.4bn, non-GAAP operating income to about 67% of revenue and adjusted EBITDA to about 68%. The issuer says projected non-GAAP measures cannot be reconciled to GAAP without unreasonable effort.
| Output | Status | Treatment |
|---|---|---|
| Q3 revenue ~$29.4bn | Management guidance | Promoted as guidance only |
| Q3 AI semiconductor $16bn | Management guidance | Subset of semiconductor revenue |
| Non-GAAP OI / adjusted EBITDA margins | Management guidance | 67% / 68% |
| $19.698bn / $19.992bn | Mechanical arithmetic | Not separate guidance |
| Q3 GAAP net income / EPS | No reconciled schedule | Withheld |
Forecast boundary: no Argus point forecast, confidence interval or event adjustment is presented.
Valuation Framework
Broadcom is best framed through cash-normalized P/E or EV-based methods only after a frozen annual schedule exists. The current input lacks that schedule, a canonical valuation assembly and a backtest; numeric intrinsic values therefore remain withheld.
| Valuation requirement | Current evidence | Status |
|---|---|---|
| Annual GAAP earnings bridge | No FY26–FY28 segment / tax / share schedule | Missing |
| After-tax acquisition amortization | Eligibility and tax treatment not frozen | Missing |
| SBC and diluted shares | Must remain in per-share economics | Required |
| Enterprise bridge | Principal vs carrying debt convention; lease policy | Unfrozen |
| FCFF / WACC / terminal value | No annual FCFF schedule | Missing |
The reference price is a market observation, not fair value. No DCF, target price, implied return or rating is presented.
Scenarios, Catalysts and Risks
Risk and catalyst analysis is trigger-based. Events change a scenario only after the affected driver, timing and accounting line are evidenced; reported market reactions are associations, not causal proof.
| Monitoring gate | Current evidence | What changes the view |
|---|---|---|
| AI program conversion | $10.8bn Q2 / $16bn Q3 guide | Shipment and acceptance evidence |
| TSMC capacity | ~95% outsourced-wafer share | Allocation, lead times and price |
| Software and RPO conversion | $7.178bn software revenue; $164.6bn RPO is cross-segment and unallocated | Licence, renewal and recognition evidence |
| Customer concentration | 42% distributor / 45% top five | Program and channel diversification |
| Debt tender | ~$2.9bn principal accepted | Cash consideration and settlement bridge |
Capital Allocation, Debt and Governance
Cash generation is strong, but Broadcom is not net-cash. Principal and carrying debt conventions produce different net-debt figures, while the AI-rack backstop remains contingent exposure rather than current debt.
| Capital item | Current evidence | Classification |
|---|---|---|
| Cash | $19.628bn at 3 May | Balance-sheet cash |
| Principal debt / net debt | $66.720bn / $47.092bn | Principal convention |
| Carrying debt / net debt | $64.907bn / $45.279bn | GAAP carrying convention |
| Q2 issuer FCF | $10.262bn; 46% of revenue | Not residual discretionary cash |
| H1 repurchases / dividends | $8.450bn / $6.178bn | Capital returns |
| Lease backstop | Up to $29bn | Contingent; not current debt |
| Debt tender | ~$2.9bn principal accepted | No pro-forma net debt without settlement bridge |
Sources, Methods and Disclosures
SEC filings and issuer materials are the source of record for current actuals. Market data are supporting observations. Mechanical guidance arithmetic and analytical diagrams are report-created.
| ID | Source | Published / snapshot | Locator | Link |
|---|---|---|---|---|
| E1 | Q2 FY2026 earnings release | 2026-06-03 | Highlights; outlook; statements; non-GAAP reconciliation | Open · www.sec.gov |
| E2 | Q2 FY2026 Form 10-Q | 2026-06-09 | Cover; Notes 2, 3, 8, 9; MD&A; Risk Factors | Open · www.sec.gov |
| E3 | Broadcom AI infrastructure portfolio | 2026-08-13 | AI infrastructure portfolio hero | Open · www.broadcom.com |
| E4 | Debt tender results | 2026-06-18 | Tender results and accepted principal | Open · www.sec.gov |
| E5 | Tomahawk Ultra product page | 2026-08-13 | BCM78920 Tomahawk Ultra product image | Open · www.broadcom.com |
| E6 | Co-packaged-optics switches | 2026-08-13 | Davisson co-packaged-optics image | Open · www.broadcom.com |
| MP | AVGO historical market price | 2026-08-12 | 12 Aug 2026 daily close | Open · finance.yahoo.com |
Key limitations
- The frozen input cut is 13 August 2026, 16:26 IST; later evidence is not implied.
- No Q3 GAAP forecast, annual forecast, backtest or canonical valuation assembly is available.
- All prior v1 net-income, EPS, FY27 P/E and DCF outputs are withheld.
- RPO, contract liabilities, guidance and contingent backstops are not recognized revenue or current debt.
- Issuer visuals are credited at point of use; analytical charts and the twin are report-created.
- This report is information for discussion, not investment advice or an offer to transact.
Forecasts, scenarios and valuations are uncertain and may differ materially from actual outcomes. Investors should independently assess suitability, liquidity, taxes and risk.