Investment View
12 Aug 2026 close · [MP]
No approved target
Scenario midpoint
17:00 IST
Gold-price leverage meets mine execution and copper growth.
Record realized gold prices support earnings, but value depends on sustaining production, controlling AISC and converting Fourmile, Lumwana and other projects into attributable cash flow. The current evidence supports a disciplined scenario framework—not a mine-level NAV target. [E1] [E2] [E3] [E4] [MP]
What must go right
Operating drivers must convert into cash within the timing and cost constraints shown in the digital twin.
What is priced imperfectly
The market can observe headline growth; the report concentrates on conversion, accounting basis and capital intensity.
Why no rating
The verified evidence does not include an approved annual schedule and valuation assembly. Sensitivities are shown without promotion to a target.
Investment Summary
Record realized gold prices support earnings, but value depends on sustaining production, controlling AISC and converting Fourmile, Lumwana and other projects into attributable cash flow. The current evidence supports a disciplined scenario framework—not a mine-level NAV target.
| Q2 operating / financial (US$ except volume) | Q2 2025 | Q2 2026 | Change |
|---|---|---|---|
| Gold production, koz | 797 | 796 | — |
| Realized gold, $/oz | 3,295 | 4,417 | +34% |
| Gold AISC, $/oz | 1,684 | 1,866 | +11% |
| Revenue, $m | 3,681 | 5,292 | +44% |
| Adjusted EBITDA, $m | 1,690 | 2,545 | +51% |
| Operating cash flow, $m | 1,329 | 1,704 | +28% |
Bar lengths compare periods only within each metric; the table preserves exact labels and units.
Commodity Variant View
Gold price is the largest near-term revenue sensitivity, but higher price does not cure weaker grade, recovery, throughput or sustaining capital. Copper adds a separate volume, price and project-timing route.
| Driver | Current evidence | What changes the view |
|---|---|---|
| Realized gold | $4,417/oz Q2 | Price realization versus spot |
| Gold production | 796koz produced; 801koz sold | Attributable ounces and sales timing |
| Gold AISC | $1,866/oz | Grade, recovery, energy, royalties and sustaining capex |
| Copper | 56kt produced; 54kt sold; $3.95/lb AISC | Price, volume and Lumwana timing |
A favourable commodity tape is not a substitute for mine execution.
Digital Twin and Portfolio
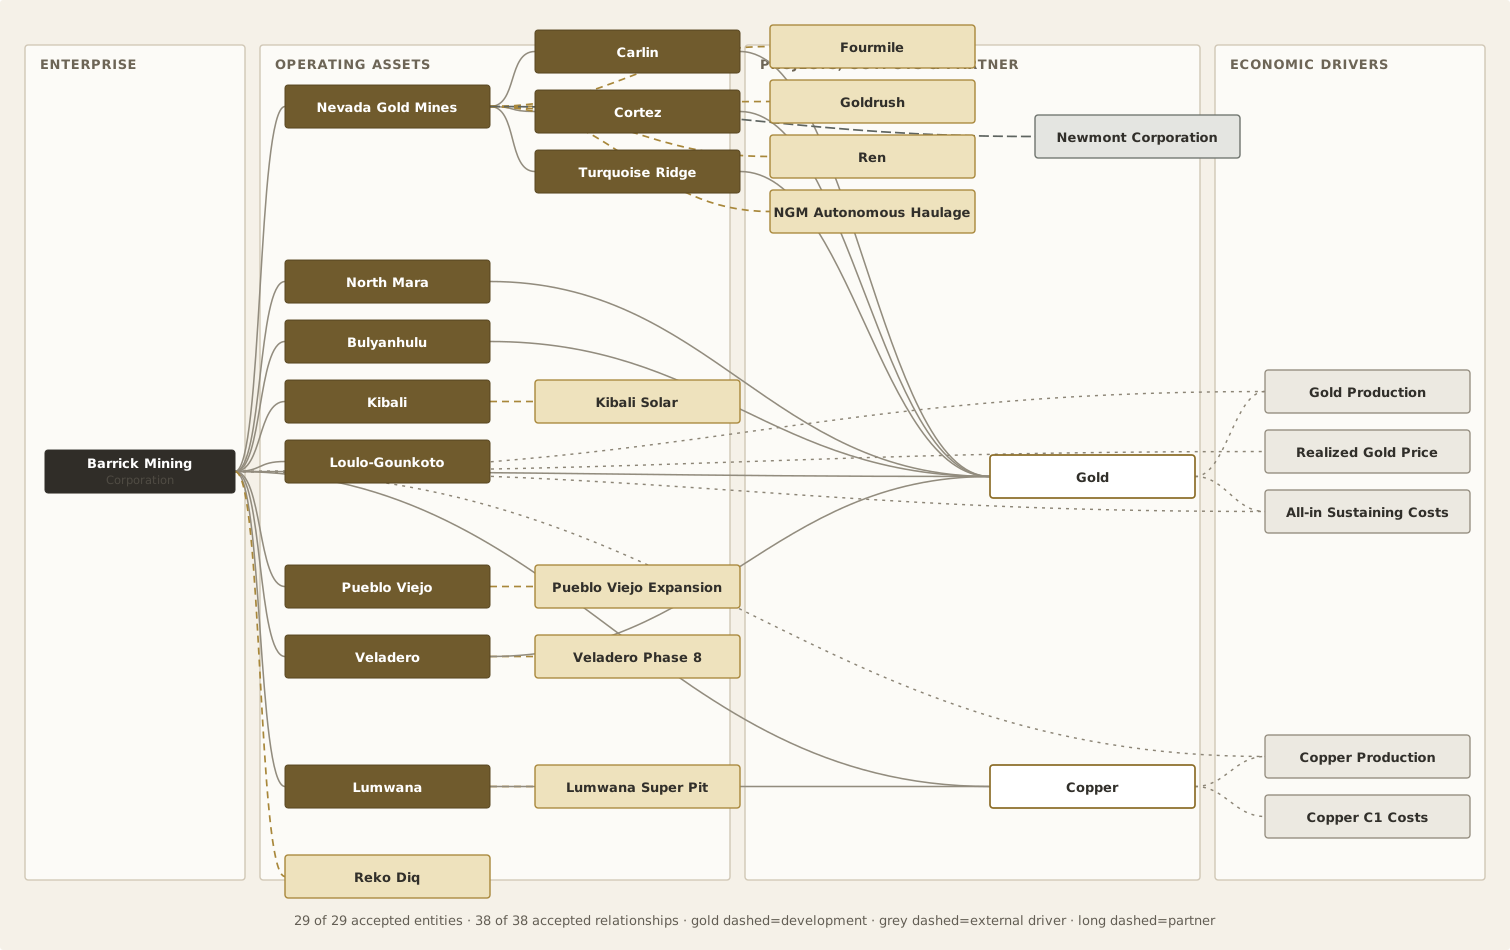
The twin connects Barrick to operating mines, embedded projects, gold and copper outputs, Newmont and the economic drivers that determine attributable cash flow. All accepted graph entities and relationships are shown; line density is not financial weighting.
| Portfolio route | Connected evidence | Investment relevance |
|---|---|---|
| Nevada Gold Mines | Carlin, Cortez, Turquoise Ridge, Goldrush, Fourmile, Ren, autonomous haulage, Newmont | Largest connected asset and option cluster |
| African portfolio | North Mara, Bulyanhulu, Kibali, Loulo-Gounkoto | Production and jurisdiction diversification |
| South America | Pueblo Viejo, Veladero and expansions | Mine-life and execution route |
| Copper growth | Lumwana → Super Pit; Reko Diq | Long-duration copper option |
Gold Operations
Barrick's gold route starts with attributable ounces sold and realized price, then subtracts cost of sales, royalties, energy and sustaining capital. Q2 production was 796koz, realized gold $4,417/oz and AISC $1,866/oz. North America supplied 494koz at $1,729/oz AISC; Africa & Middle East 243koz at $2,039/oz. [E1] [E2] [E3]
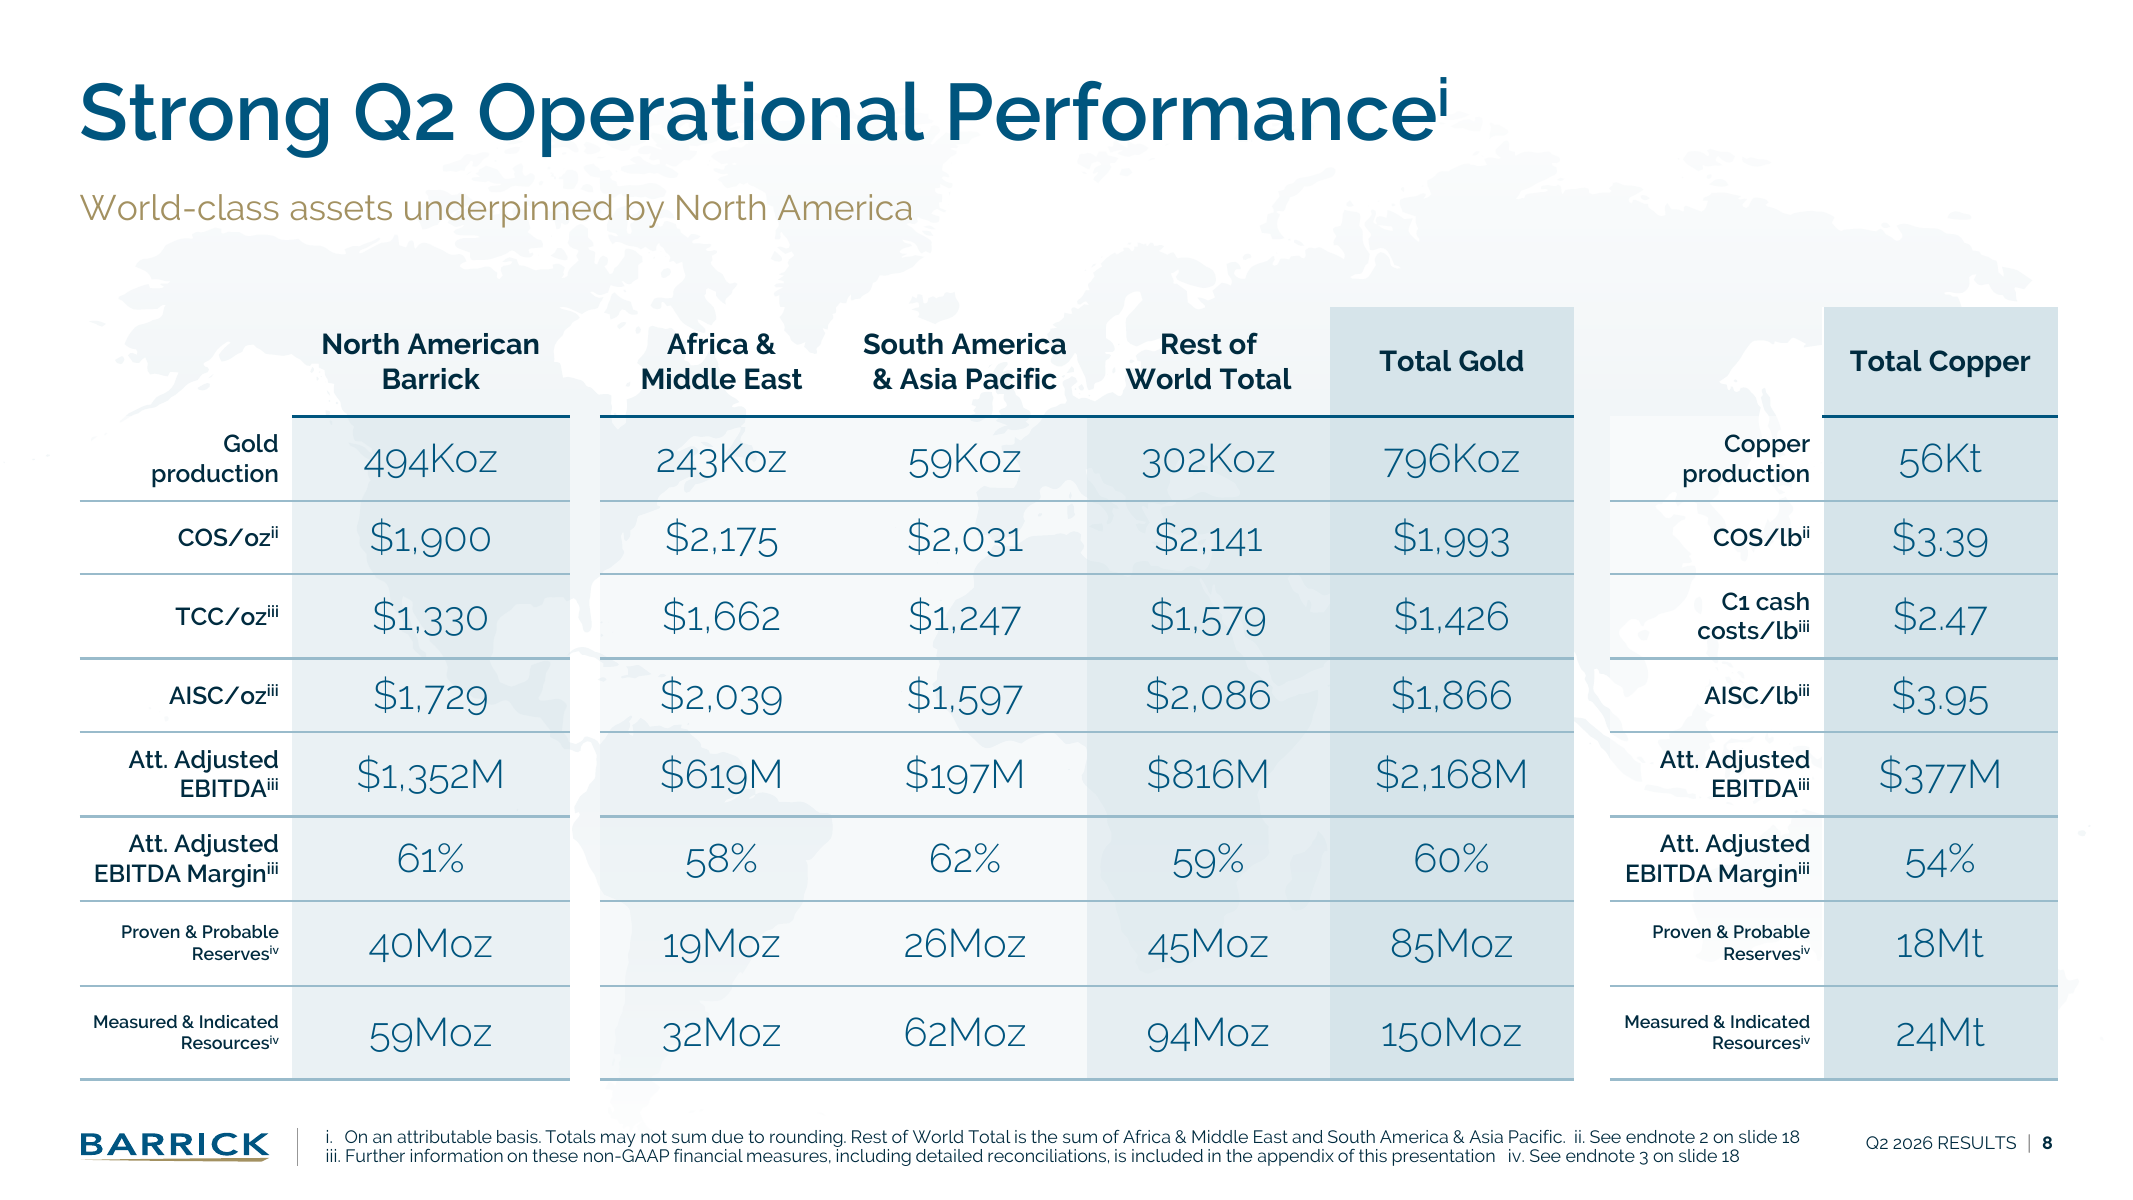
| Region | Gold production | Gold AISC† | Att. adj. EBITDA margin† |
|---|---|---|---|
| North America | 494koz | $1,729/oz | 61% |
| Africa & Middle East | 243koz | $2,039/oz | 58% |
| South America & APAC | 59koz | $1,597/oz | 62% |
| Total Gold | 796koz | $1,866/oz | 60% |
† Non-GAAP. Regional production and AISC should be read together; neither reserves nor resources are a current-quarter earnings measure.
Copper and Growth Projects
Copper is smaller today but strategically important. Q2 production was 56kt and copper AISC $3.95/lb. Lumwana's expansion targets about 240kt annual copper with first copper around end-Q1 2028; construction timing, capex and commissioning remain outside the Q3 base. [E1] [E2] [E3]
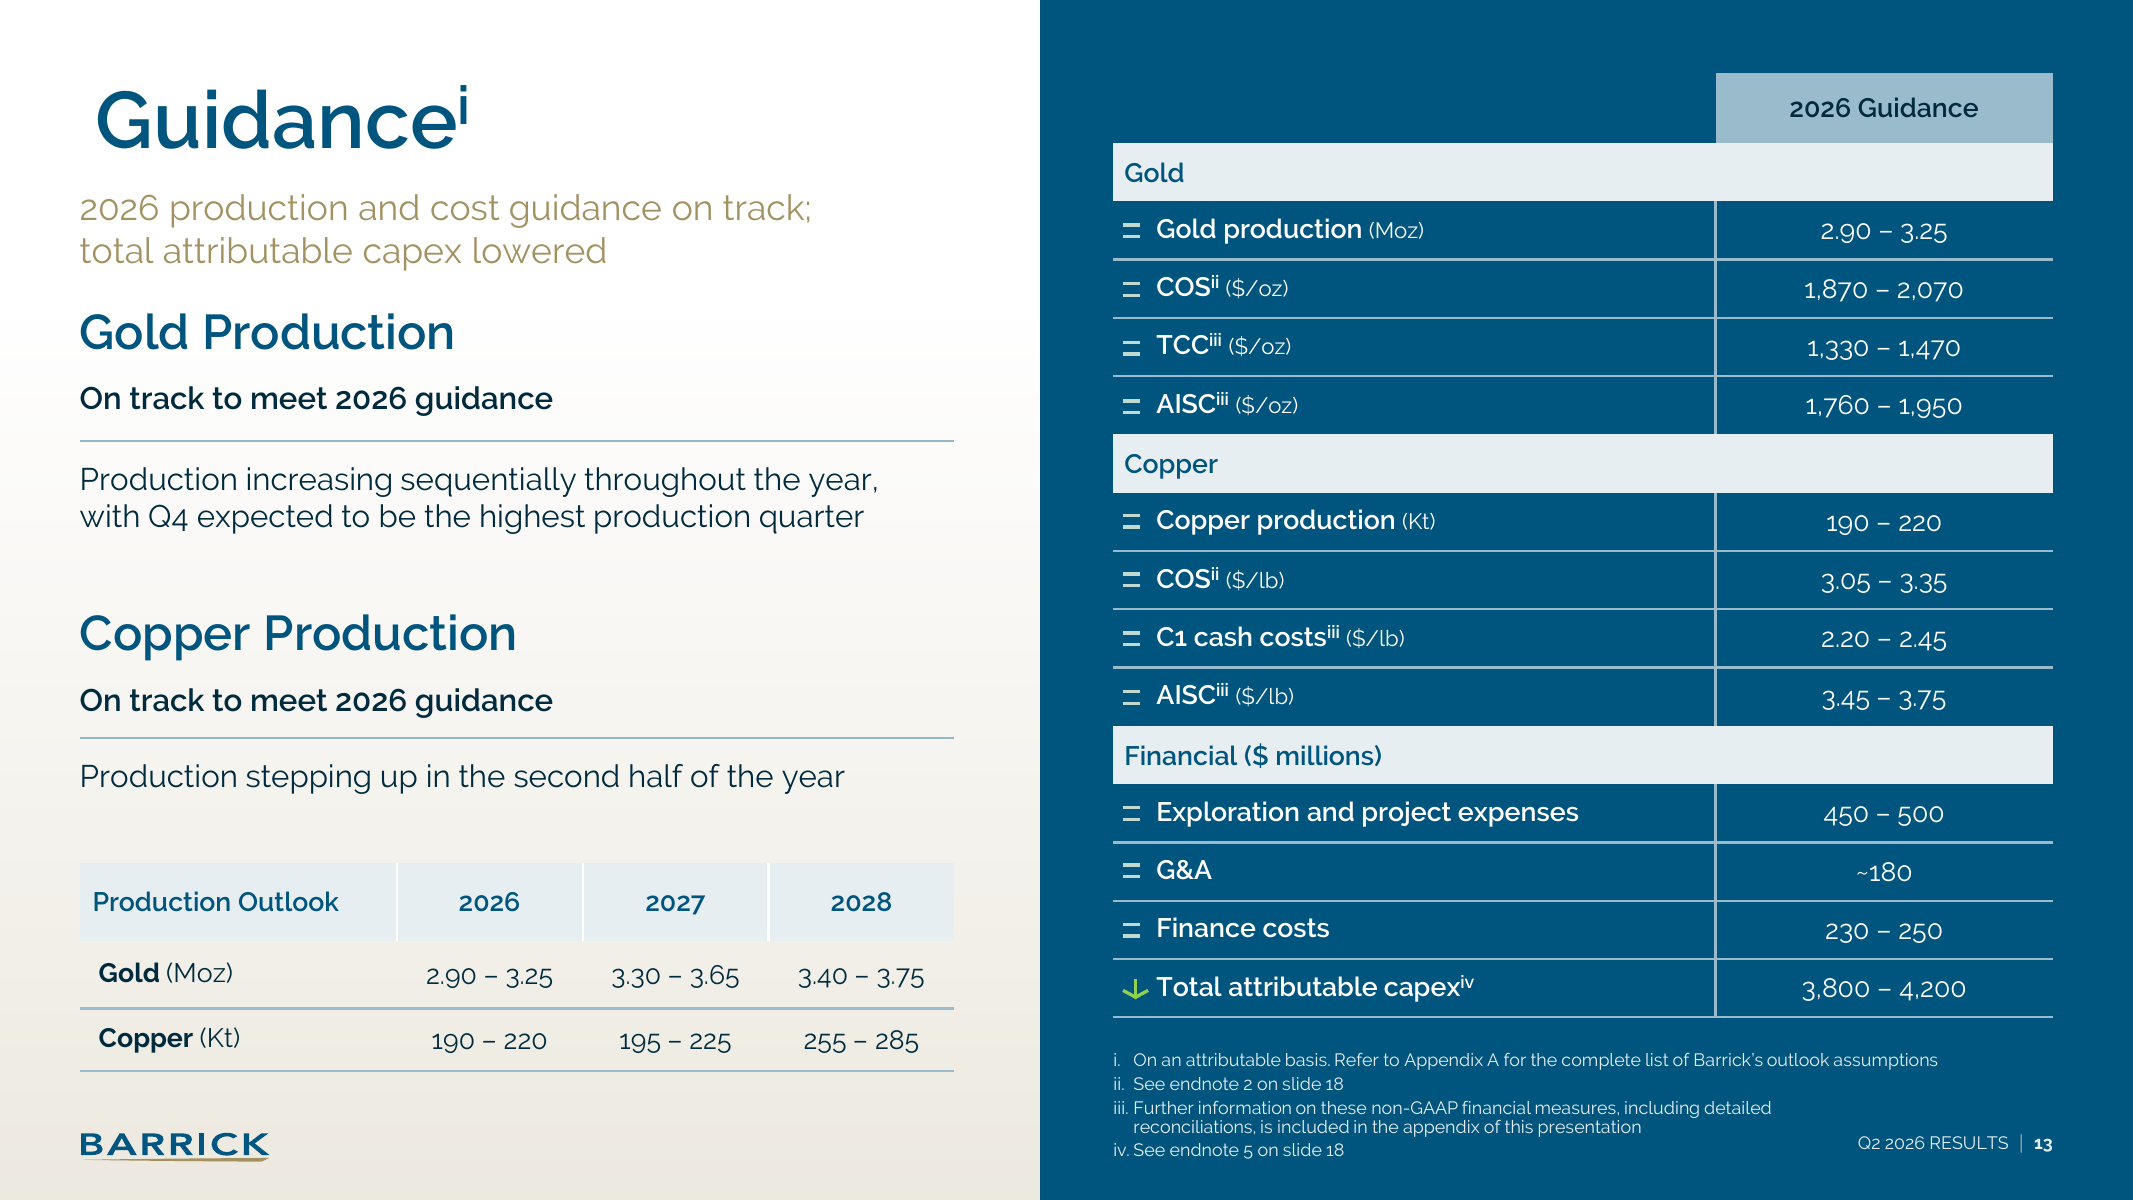
| Outlook | 2026 | 2027 | 2028 |
|---|---|---|---|
| Gold, Moz | 2.90–3.25 | 3.30–3.65 | 3.40–3.75 |
| Copper, kt | 190–220 | 195–225 | 255–285 |
Q1+Q2 attributable production was 1.515Moz gold and 105kt copper, implying H2 guidance of 1.385–1.735Moz and 85–115kt. Guidance and outlook are management ranges—not realized results or an approved annual forecast.
Mine Execution and Cost Curve
Mine execution means grade, recovery, throughput, maintenance and operating continuity. Goldrush lifted Cortez underground tonnes; Loulo-Gounkoto continued its restart ramp. Higher realized metal prices can conceal cost slippage, so production and AISC must be read together. [E1] [E2]
| Mechanism | Q2 observation | Why it matters |
|---|---|---|
| Production | Gold +11% QoQ; copper +14% QoQ | Throughput and continuity improved |
| Gold cost | $1,866/oz AISC versus $1,708 Q1 | Cost increased despite higher output |
| Copper cost | $2.47/lb C1 versus $2.57 Q1 | Unit cash cost improved |
| Cortez / Goldrush | Highest underground tonnes since ramp | Execution evidence, not standalone valuation |
Realized gold price can mask cost slippage. Mine economics require volume, recovery, AISC and sustaining capital in the same review.
Partnerships and Optionality
Fourmile, the Newmont agreement and Reko Diq are option-value routes, not automatic revenue revisions. A mine-level NAV requires attributable ownership, reserves/resources, mine lives, production, sustaining and growth capex, tax and royalties for each asset. [E1] [E2]
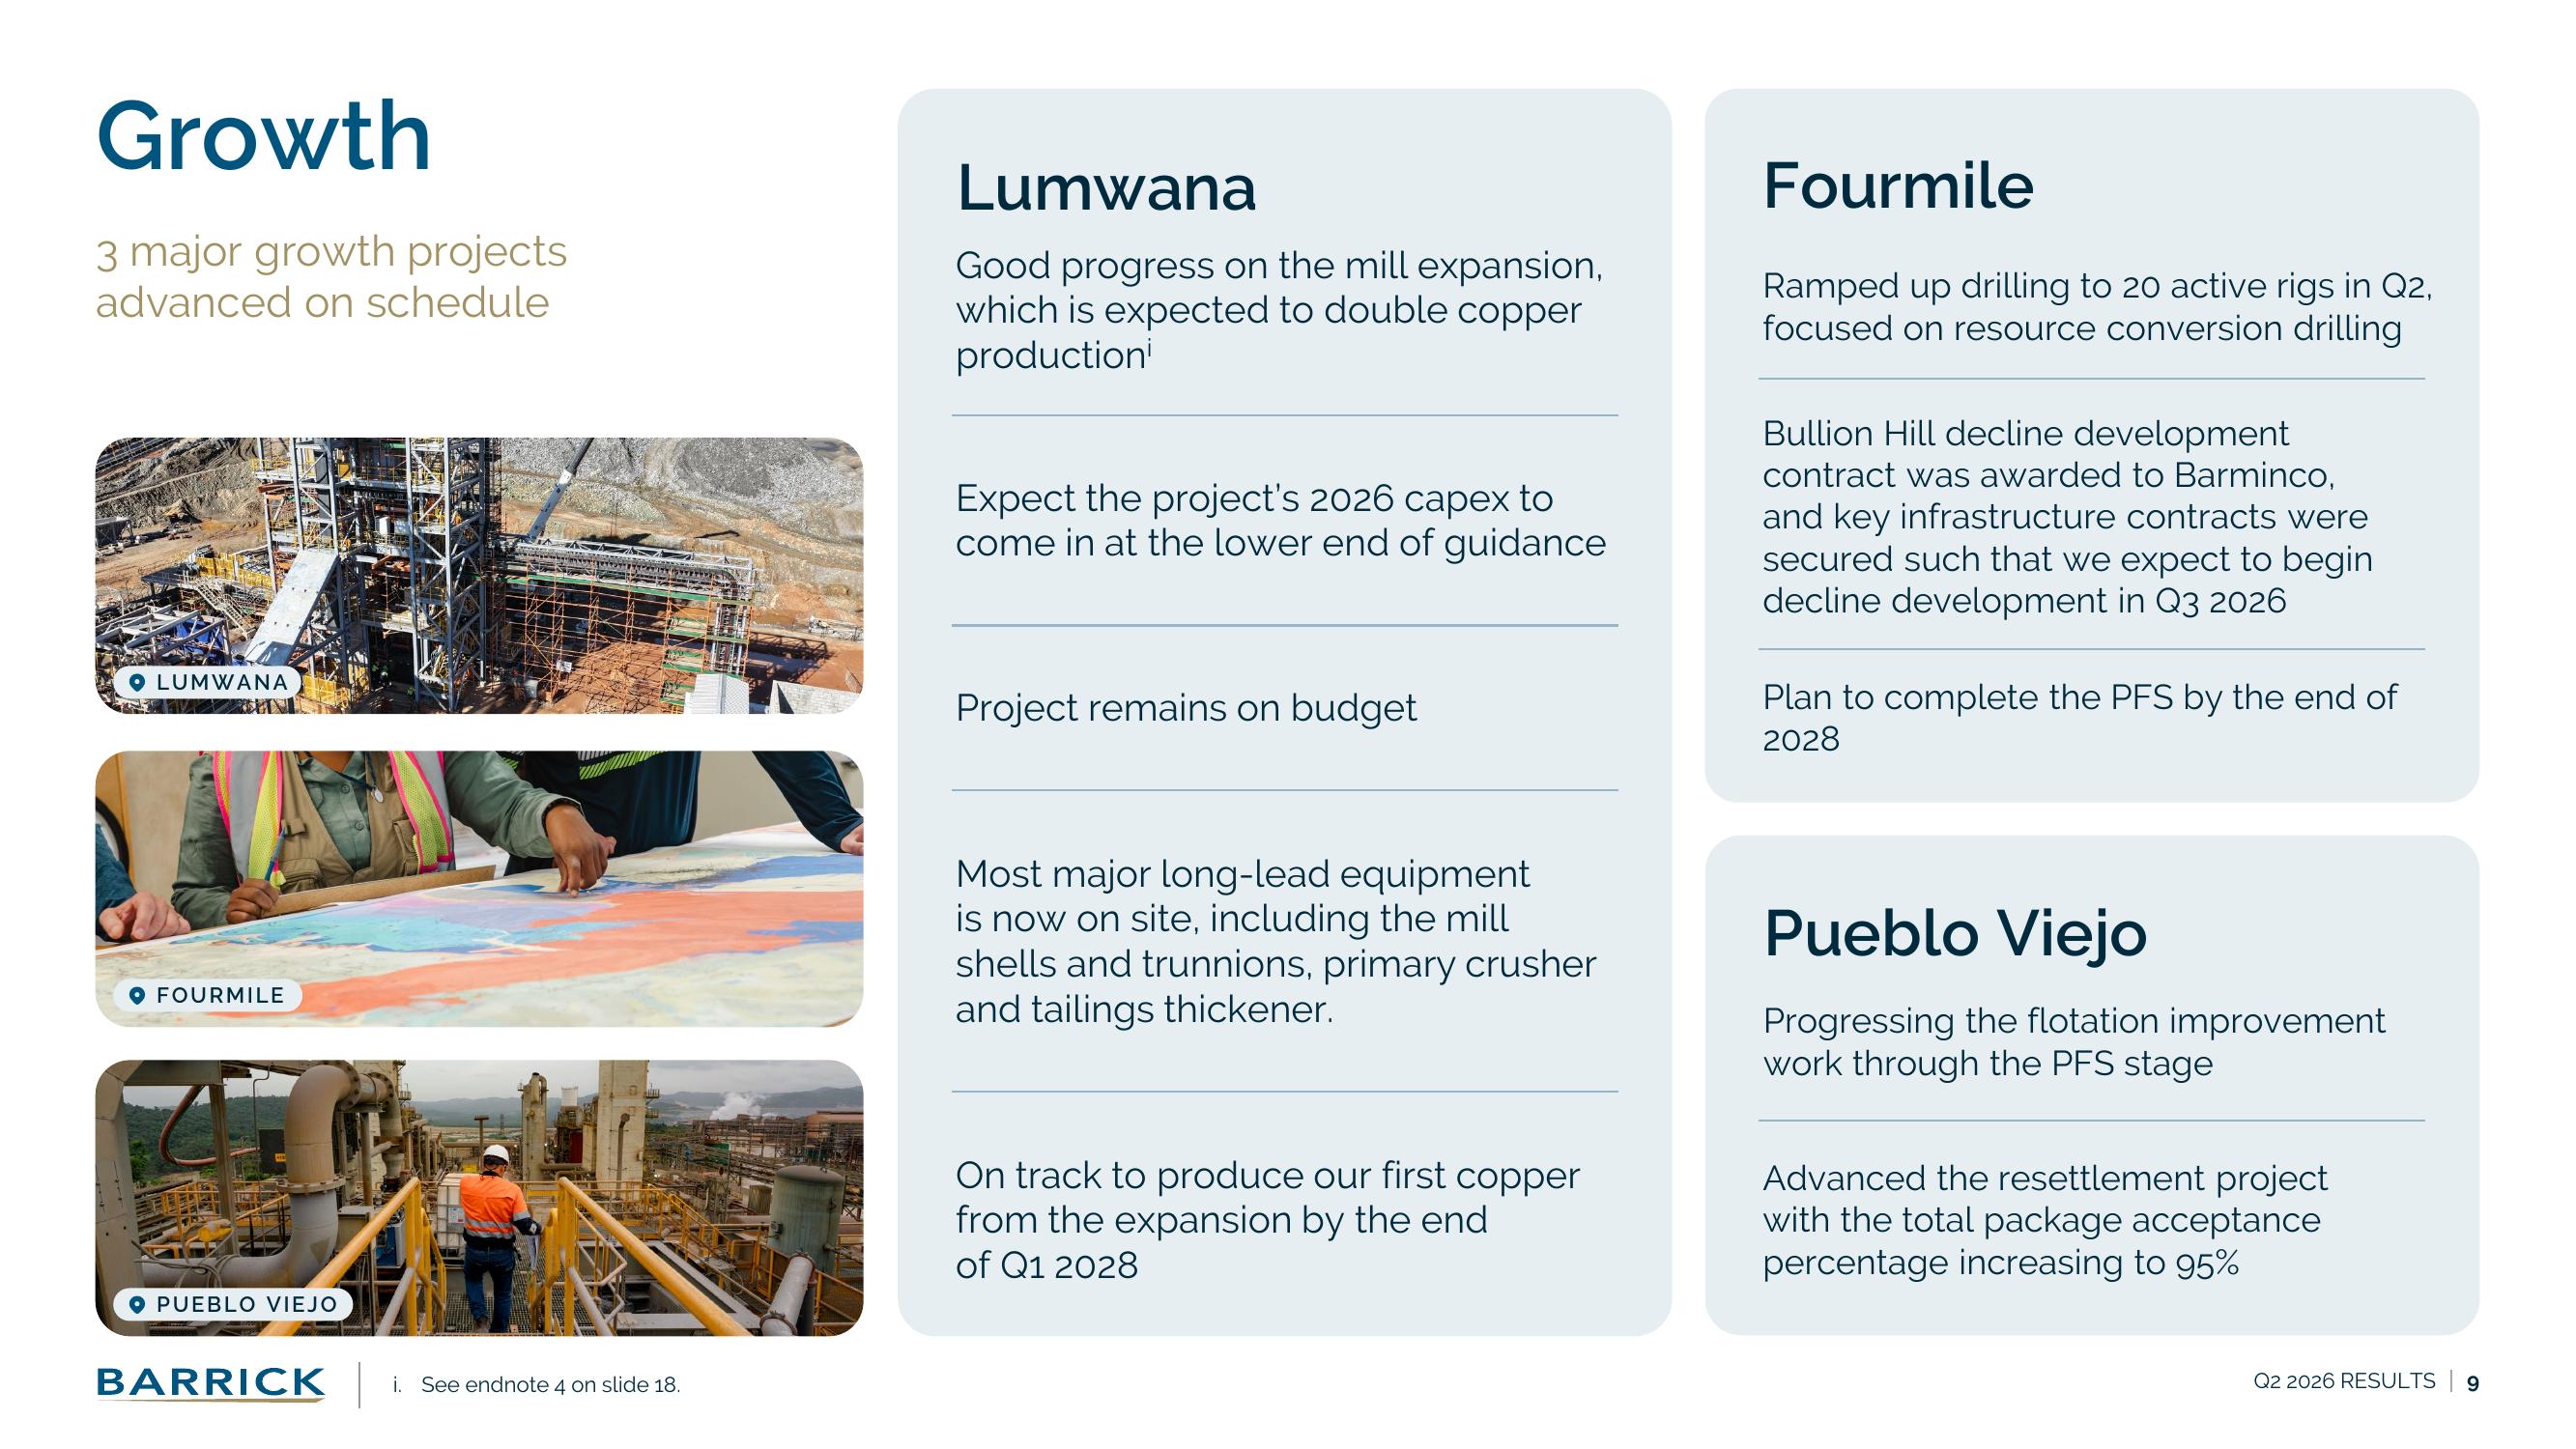
| Route | Current evidence | Required before value recognition |
|---|---|---|
| Lumwana | Expansion on budget; first copper target end-Q1 2028 | Attributable capex, ramp and operating schedule |
| Fourmile | 20 rigs; decline planned Q3 2026; PFS target end-2028 | Resource conversion, ownership and development plan |
| Pueblo Viejo | Flotation PFS; resettlement acceptance 95% | Recoveries, capex and revised mine plan |
| Newmont / NGM | Agreement includes option routes and $1.95bn top-up | Signed economics and attributable ownership |
| Reko Diq | Pacing under review | Project plan and funding route |
Project evidence supports optionality and monitoring. It does not create automatic Q3 revenue or mine-level NAV.
Financial Record and Accounting
The latest issuer filing is the protected actual. GAAP and non-GAAP measures stay explicitly separated; consolidated and attributable measures are not blended.
| Measure | Current value | Basis |
|---|---|---|
| Revenue | $5,292m | Q2 quarter · consolidated · US$ |
| Adjusted EBITDA | $2,545m | Q2 quarter · attributable · issuer non-GAAP · US$ |
| Net earnings | $1,217m | Q2 quarter · attributable to equity holders · US$ |
| Operating cash flow | $1,704m | Q2 quarter · consolidated · US$ |
| Attributable free cash flow | $141m | Issuer non-GAAP · US$ |
| Gold AISC | $1,866/oz | Issuer non-GAAP; includes sustaining capital |
Accounting discipline: adjusted EBITDA, AISC and attributable FCF retain issuer definitions. No stale provider metric replaces the current filing.
Forecast Mechanics
The manual Q3 control is a commodity-and-volume bridge, not a completed mine-by-mine annual forecast. It is frozen for reproducibility but remains analyst-review-required; no canonical NTM or annual schedule is presented. Source-backed Q2 anchors and analyst inputs are separated below.
| Control | Treatment |
|---|---|
| Control ID | abx_to_manual_20260813_q3_v1 |
| Q2 revenue anchor | $5,292m consolidated issuer actual; scenario components are analyst bridge inputs |
| Gold revenue | $4,778.008m; $4,350/oz and +4% volume control |
| Copper revenue | $486.829m; $6.00/lb control |
| Other revenue | $128.000m analyst component |
| Net income / EPS | Revenue × normalized margin ÷ 1.666bn diluted shares |
| Events | No causal event adjustment |
| Approval | Analyst review required |
Q3 Forecast and Scenarios
| Scenario | Gold revenue | Copper revenue | Other revenue | Net margin |
|---|---|---|---|---|
| Downside | $4,204.647m | $428.410m | $112.640m | 16.62% |
| Base | $4,778.008m | $486.829m | $128.000m | 22.50% |
| Upside | $5,351.369m | $545.249m | $143.360m | 27.12% |
Forecast status: frozen for discussion and analyst-review-required. The ranges are sensitivities, not confidence intervals, probabilities or consensus bands.
Cash Flow and Shareholder Returns
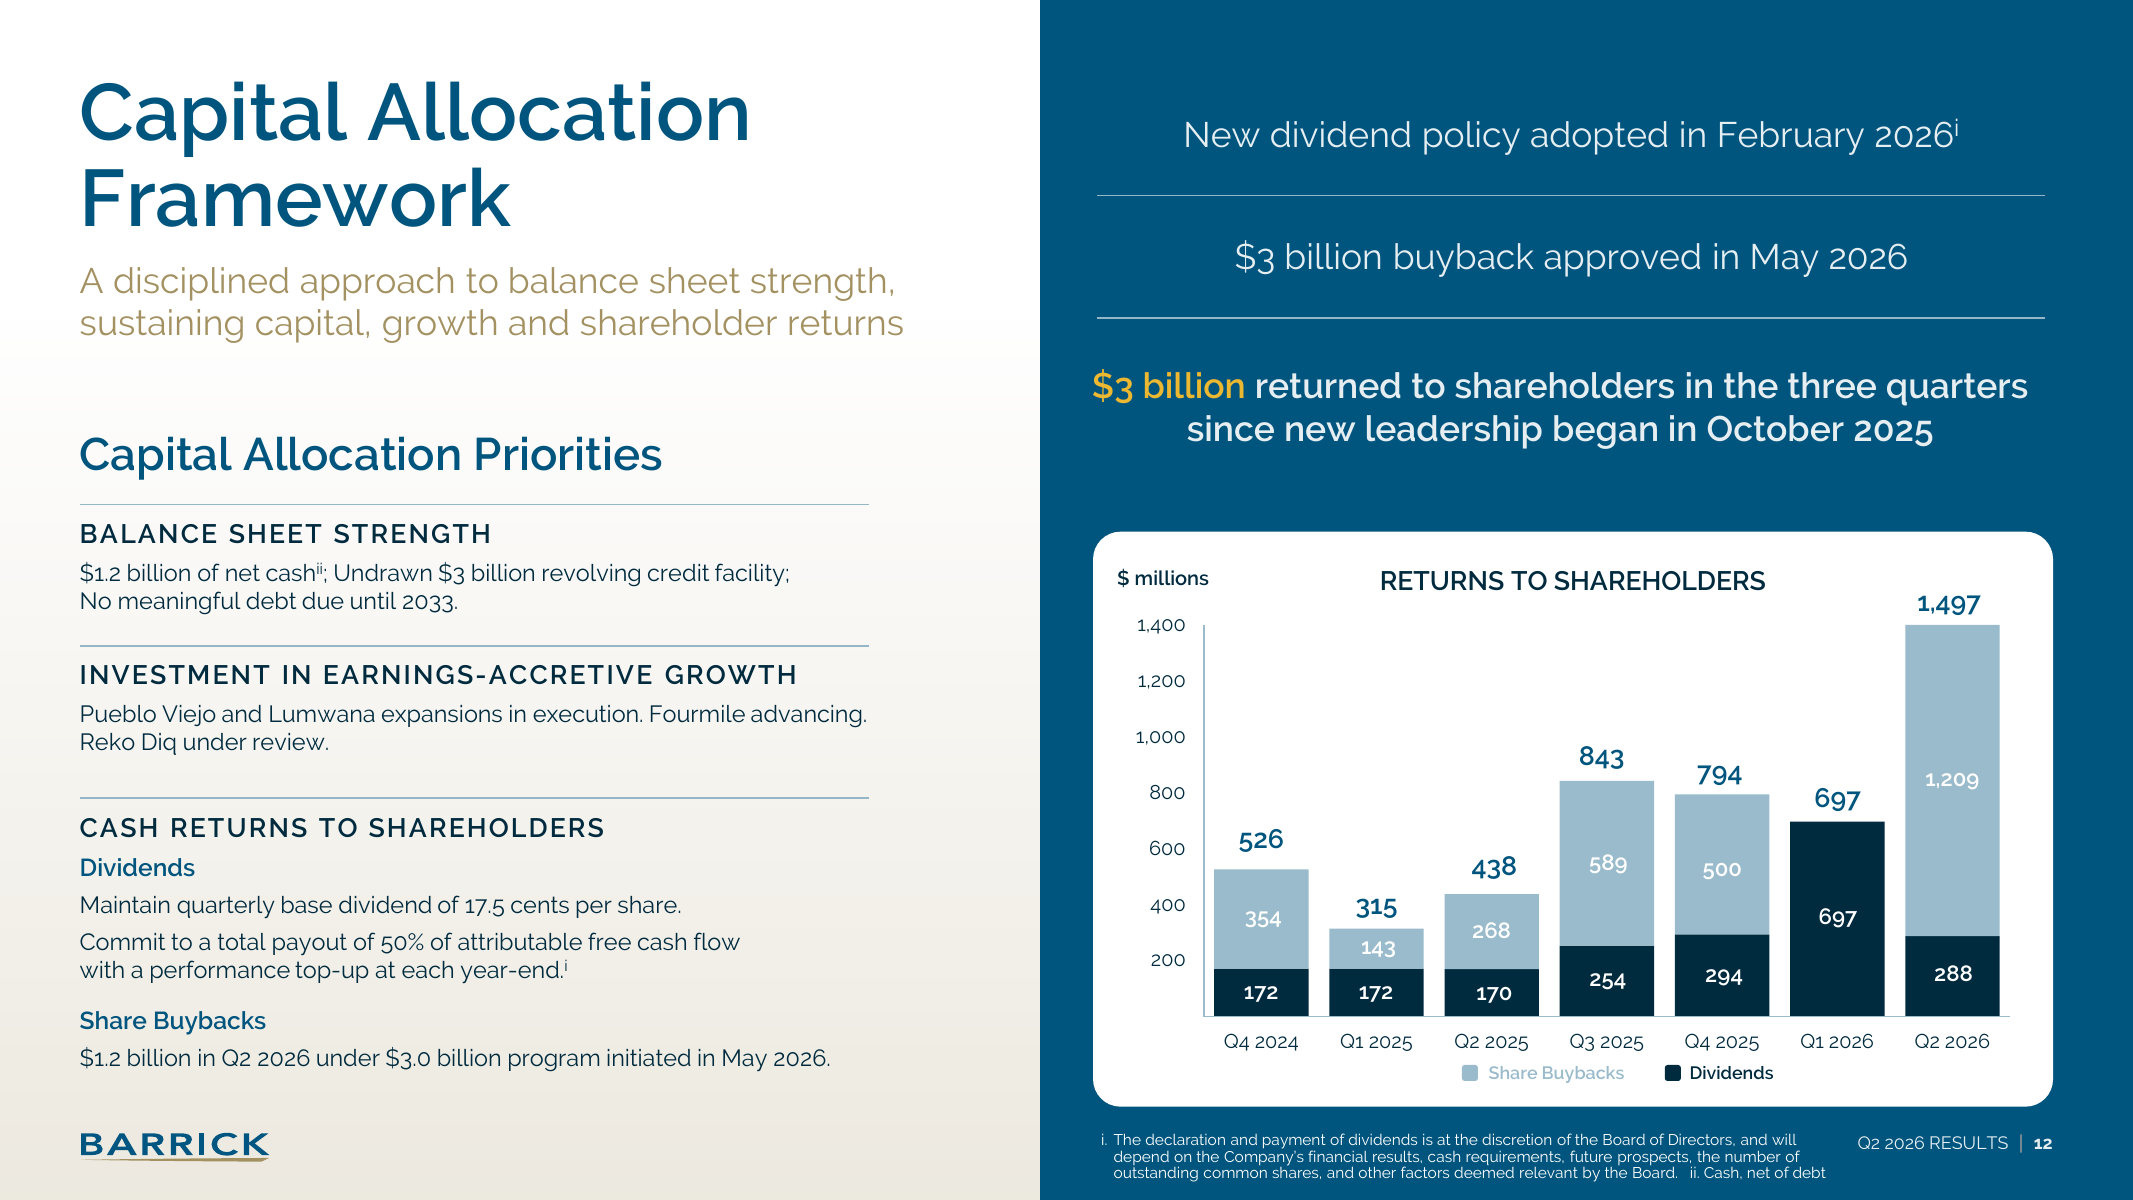
Q2 cash conversion was strong at the consolidated level, while attributable FCF was below Q2 2025 and shareholder returns materially exceeded current-quarter attributable FCF. Balance-sheet capacity therefore matters to the distribution decision.
| Measure | Q2 2026 | Interpretation |
|---|---|---|
| Operating cash flow | $1,704m | +28% YoY |
| Attributable free cash flow | $141m | Versus $212m Q2 2025 |
| Q2 dividends | $288m | Cash return |
| Q2 buybacks | $1,209m | Cash return |
| Total Q2 shareholder returns | $1,497m | Issuer presentation p12 |
Barrick reported approximately $1.2bn net cash at quarter-end. That liquidity statement does not turn repurchases into a recurring payout forecast.
NAV Valuation Framework
A producing miner should be valued mine by mine. The twin identifies the relevant assets, but it does not contain the reserve, ownership and life-of-mine schedules required to calculate NAV. No price target or rating is issued.
| Required input | Why it matters | Status |
|---|---|---|
| Asset ownership | Attributable percentage by mine/JV | Required |
| Reserve and mine life | Ore, grade, recovery and annual schedule | Required |
| Costs and capital | Site opex, sustaining and growth capex | Required |
| Fiscal terms | Tax, royalty and country risk | Required |
| Enterprise bridge | Net debt and non-operating assets | Required |
| Role | Method | Evidence requirement |
|---|---|---|
| Primary | Asset-level NAV / DCF | Needs reserves, ownership, mine life, costs, capex, taxes and royalties |
| Cross-check | Commodity-normalized EV / EBITDA | Needs verified net debt and comparable multiples |
| Sensitivity | Gold and copper price matrix | Must preserve production-versus-sales and cost semantics |
The report contains operating and forecast sensitivities, but no mine-level NAV, implied return, target price or rating.
Risks and Catalysts
Risks and catalysts are routed through an asset, measurable operating evidence and an accounting line before they enter a forecast. Event-window returns are observations, not proof of causality.
| Monitoring gate | Current status | What changes the model |
|---|---|---|
| Gold price / AISC | $4,417/oz realized; $1,866/oz AISC | Updated realization and mine costs |
| Loulo-Gounkoto | Restart ramp | Sustained attributable production |
| Fourmile / NGM | Drilling and agreement routes | Ownership, PFS and development schedule |
| Lumwana | First copper target end-Q1 2028 | Capex, construction and commissioning |
| Reko Diq | Pacing under review | Approved project and funding plan |
| Capital returns | $1.497bn Q2 | Executed buybacks, dividend policy and liquidity |
Sources, Methods and Disclosures
SEC filings and issuer financial materials are the source of record for current actuals. Market data are supporting observations. Forward scenarios, formulas and valuation sensitivities are analyst calculations.
| ID | Source | Published / snapshot | Link |
|---|---|---|---|
| E1 | Barrick Q2 2026 results | 2026-08-11 | Open · www.sec.gov |
| E2 | Q2 2026 MD&A | 2026-08-11 | Open · www.sec.gov |
| E3 | Q2 2026 results presentation | 2026-08-10 | Open · s25.q4cdn.com |
| E4 | Q1 2026 results | 2026-05-11 | Open · www.sec.gov |
| MP | ABX.TO historical market price | 2026-08-12 | Open · finance.yahoo.com |
Key limitations
- The Q3 control is frozen but remains analyst-review-required.
- No approved annual schedule or valuation assembly was available at the evidence cut.
- Issuer visuals are credited at point of use; analytical charts and the digital-twin rendering are report-created.
- Provider actuals that conflict with current issuer definitions are not blended into reported results.
- This report is information for discussion, not investment advice or an offer to transact.
Forecasts, scenarios and valuations are uncertain and may differ materially from actual outcomes. Investors should independently assess suitability, liquidity, taxes and risk.