JD.com, Inc.

Initiation of coverage

JD.com, Inc.

Retail remains sound; delivery investment is the earnings debate

9618.HKHong Kong Stock ExchangeIntegrated retail, marketplace and supply-chain services2026-08-04
Evidence-backed research POC. Model indication: HOLD; target HKD 144. Rating pending analyst approval.

Contents

Research cut 2026-08-04T23:59:59+08:00. Report figures are model outputs unless explicitly labelled reported or preliminary.

01

Investment Summary

Retail remains sound; delivery investment is the earnings debate

RatingHOLD
Target priceHKD 144
Reference priceHKD 129
Implied return11.5%

JD enters 2026 with a stronger retail franchise, a nationwide fulfilment network and a balance sheet capable of funding new initiatives. The central question is no longer whether the group can grow. It is how much of JD Retail's profit and logistics progress will be consumed by food delivery, Jingxi and overseas expansion before those businesses establish durable unit economics.

What matters

Retail is funding the option set

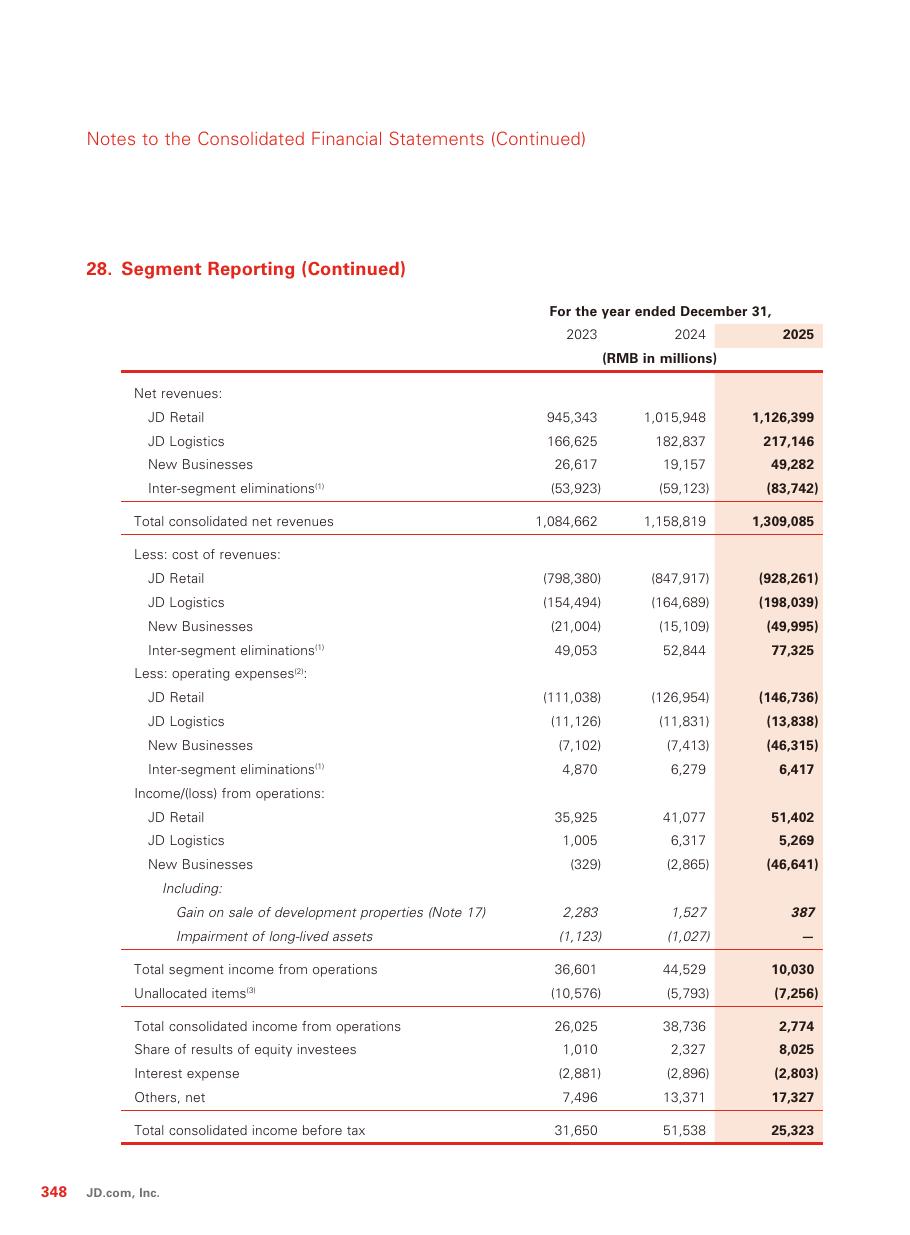
JD Retail generated RMB51.4bn of segment operating income in 2025 and a 4.6% operating margin. That core profit pool supports logistics, buybacks and new initiatives, but it also makes the cost of delivery expansion easier to underestimate when group earnings are viewed in isolation.

JD.com Annual Report 2025

The network is difficult to replicate and expensive to carry

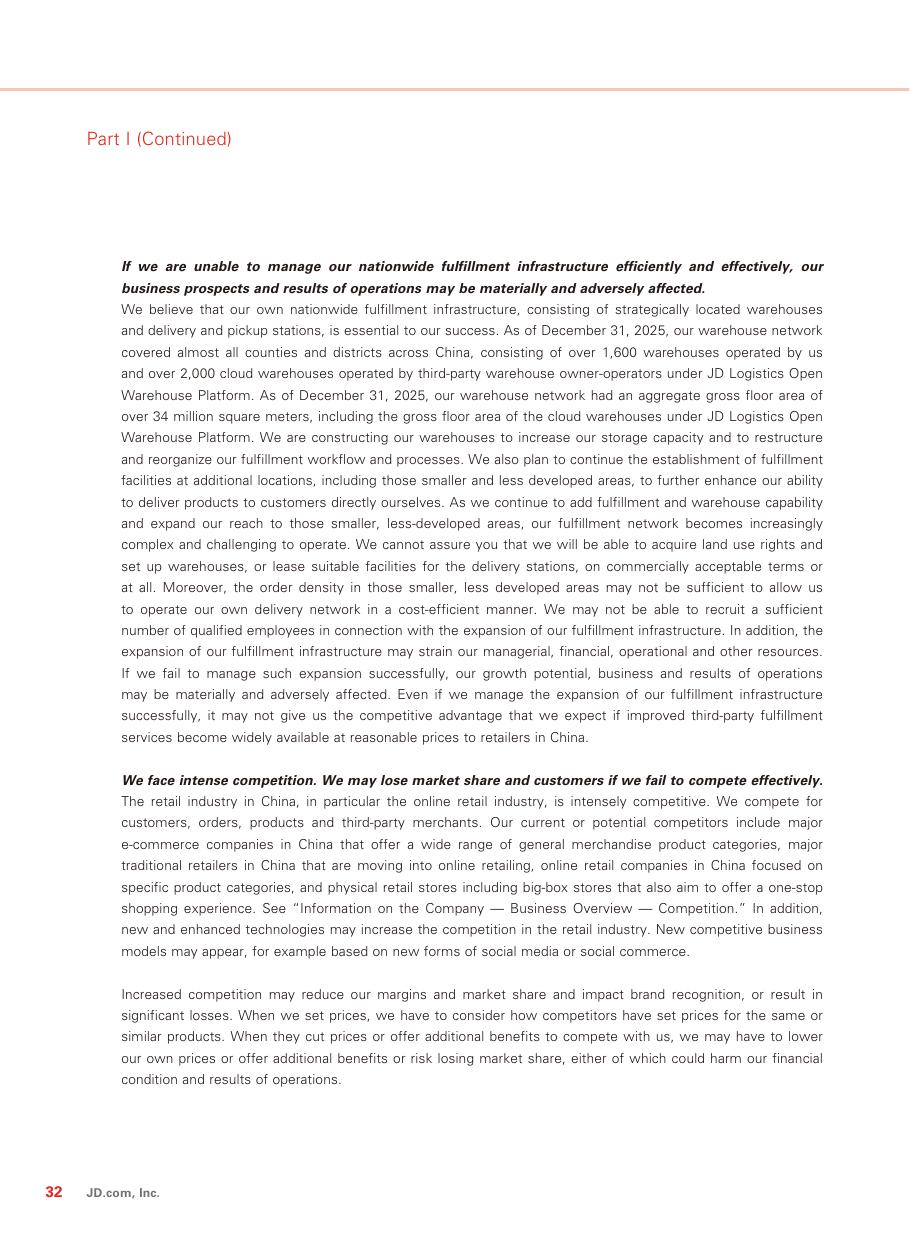
At year-end 2025, JD's network included more than 1,600 operated warehouses and more than 2,000 cloud warehouses, with over 34m square metres of aggregate gross floor area. Density can improve speed and unit cost; weak utilization turns the same advantage into operating leverage in reverse.

JD.com Annual Report 2025

New Businesses is the swing factor

New Businesses revenue rose 157.3% to RMB49.3bn in 2025, but the segment recorded a RMB46.6bn operating loss. Our base case assumes gradual loss narrowing rather than an abrupt move to profitability, which keeps FY2026 EPS below current provider consensus.

JD.com Annual Report 2025

The balance sheet protects the thesis, not the forecast

Cash and short-term investments exceeded debt by roughly RMB42.5bn at FY2025 year-end, while repurchases continued in Q1 2026. This creates flexibility, but it does not by itself validate the economics of food delivery or overseas expansion.

FMP structured market and financial snapshot

Share-price history045911361812024-082024-092024-112025-012025-032025-052025-072025-092025-112026-012026-032026-052026-072026-08Share price
Reference-price history. The valuation date is fixed; subsequent prices are not included.
PeriodRevenueGrowthEBITDA marginEPS
FY2026CNY 1,360,000.0m3.9%2.9%8.54
FY2027CNY 1,445,000.0m6.2%3.4%11.79
FY2028CNY 1,530,000.0m5.9%3.9%14.60

The rating is a model indication pending analyst approval. It is not personalized investment advice.

02

Thesis and Variant View

The variant view is about conversion, not the existence of demand.

Retail is funding the option set

JD Retail generated RMB51.4bn of segment operating income in 2025 and a 4.6% operating margin. That core profit pool supports logistics, buybacks and new initiatives, but it also makes the cost of delivery expansion easier to underestimate when group earnings are viewed in isolation.

The network is difficult to replicate and expensive to carry

At year-end 2025, JD's network included more than 1,600 operated warehouses and more than 2,000 cloud warehouses, with over 34m square metres of aggregate gross floor area. Density can improve speed and unit cost; weak utilization turns the same advantage into operating leverage in reverse.

New Businesses is the swing factor

New Businesses revenue rose 157.3% to RMB49.3bn in 2025, but the segment recorded a RMB46.6bn operating loss. Our base case assumes gradual loss narrowing rather than an abrupt move to profitability, which keeps FY2026 EPS below current provider consensus.

The balance sheet protects the thesis, not the forecast

Cash and short-term investments exceeded debt by roughly RMB42.5bn at FY2025 year-end, while repurchases continued in Q1 2026. This creates flexibility, but it does not by itself validate the economics of food delivery or overseas expansion.

03

Business Model

JD.com combines first-party retail, a third-party marketplace, advertising, logistics, on-demand delivery, healthcare, industrial procurement and logistics-property infrastructure. The group currently reports JD Retail, JD Logistics and New Businesses. Its owned and partner-operated fulfilment network is both a competitive advantage and a substantial fixed-cost and working-capital commitment.

Business lineWhat it doesPrimary earnings driver
JD RetailFirst-party retail, third-party marketplace and marketing services, including controlled healthcare and industrial platforms.Category demand, price competitiveness, merchandise margin, marketplace mix and promotional intensity
JD LogisticsIntegrated supply-chain, warehousing, distribution, express, freight and on-demand delivery services for JD and external customers.External customer growth, network utilization, labor productivity, service mix and capex
New BusinessesFood delivery, Jingxi, JD Property and overseas initiatives under the current reporting structure.Order density, customer acquisition, rider economics, property monetization and funding discipline
Marketplace and advertisingCapital-light commissions and marketing services earned from merchants using JD traffic and transaction infrastructure.Merchant participation, conversion, advertising return and consumer trust
JD.com headquarters in Beijing
JD.com headquarters in Beijing. Source: JD.com official media library.
FY2025 segment Revenue and operating income
FY2025 segment Revenue and operating income. Source: JD.com Annual Report 2025, p. 348.
04

Company Operating Map

A compact view of how products, capacity, counterparties and risks connect to the financial model.

Revised in v5
Reviewed company system mapJD.com31 entities / 32 relationshipsBusiness structure2JD RetailNew BusinessesCorporate5Dada Nexus LimitedJD Health International Inc.JD Logistics, Inc.Operations and facilities2JD LogisticsJD warehouse networkBusiness drivers3Consumer demand, price competitiveness andproduct mixMarketplace merchant participation andadvertising demandWarehouse density, delivery capacity andutilizationProducts and technology5First-party online retailJD Food DeliveryJingxiCustomers and ecosystem3Consumers in ChinaThird-party business customersthird-party merchantsSupply chain2Domestic and cross-border manufacturers,distributors and resellersThird-party couriers and cloud-warehouseoperatorsRisks and constraints5Cybersecurity, data privacy and platformregulationFood-delivery investment and New BusinesseslossesFulfillment disruption and infrastructure damage
Highest-relevance reviewed entities grouped by operating role. Counts cover the full published graph; the complete relationship-level network remains available in the interactive company twin.
Driver to financial metric mapBusiness driversFinancial compartmentsForecast metricsNew Businesses lossesRetail marginConsumer demandLogistics utilizationMarketplace mixShare repurchasesNew Business RevenueOperating expensesRetail gross profitOperating marginRetail RevenueLogistics RevenueFixed-cost absorptionRevenueEPS
Driver paths describe a financial mechanism, not proven causality. Only reviewed driver-to-financial mappings enter the forecast; a graph connection alone never creates an earnings adjustment.
05

Industry and Demand

Chinese e-commerce growth is increasingly a share and service-quality contest rather than a simple penetration story. Price, assortment, authenticity and fulfilment reliability compete for the same household wallet.

Marketplace and advertising revenue can lift group margin because merchants own inventory, but merchant quality, platform governance and measurable advertising returns determine whether the mix is durable.

On-demand retail collapses the distinction between digital commerce and local logistics. Order density improves rider economics, while aggressive subsidies can create volume without an acceptable return on capital.

JD Logistics has a separate external growth opportunity. The relevant evidence is not warehouse count alone, but external customer retention, asset utilization, labor productivity and the margin earned on complex contracts.

Reviewed driver importance0%27%55%82%109%96.0%New Businesses los92.0%Retail margin82.0%Consumer demand78.0%Logistics utilizat70.0%Marketplace mix58.0%Share repurchases
Monitoring priorities derived from filings, operating disclosures and the reviewed company graph.
06

Platforms and Services

Product or marketRoleWhy it matters
JingxiValue-oriented retail initiativeIts relevance depends on differentiated sourcing, low fulfillment cost, repeat purchasing and disciplined customer acquisition. Aggressive pricing can add volume while diluting margin if supply-chain efficiency does not compensate.
JD RetailCore retail, marketplace and marketing segmentThis is JD.com's largest segment and principal profit contributor. Consumer demand, price competitiveness, category mix, supplier terms, merchant participation, advertising conversion and promotion intensity drive its revenue and operating margin.
New BusinessesFood delivery, Jingxi, property and overseas portfolioThe segment grew rapidly but recorded a RMB46.641 billion FY2025 operating loss. Customer adoption, order density, rider economics, promotional intensity and management's willingness to fund expansion are therefore central to group profitability.
First-party online retailInventory-owning retail modelSales growth must be assessed with category mix, supplier rebates and terms, inventory turnover, markdowns, fulfillment cost and product returns. Higher revenue does not necessarily improve margin when competition or promotions intensify.
JD Food DeliveryOn-demand local delivery initiativeThe initiative can expand transaction frequency, but economics depend on order density, merchant coverage, rider cost, customer retention, commissions and subsidies. It is currently an investment burden rather than a proven profit contributor.
Marketplace marketing servicesMerchant advertising and promotion serviceMarketing revenue is linked to merchant participation, traffic, conversion and advertising return on spend. It is generally more capital-light than first-party product sales but depends on a healthy and competitive merchant ecosystem.
Warehousing, distribution, express and freightCore logistics service portfolioShipment volume, route density, warehouse utilization, labor and transport costs, service levels and external-customer mix determine whether network scale produces operating leverage.
JD's offline retail format illustrates the group's omnichannel reach
JD's offline retail format illustrates the group's omnichannel reach. Source: JD.com official media library.
First-quarter 2026 reported results
First-quarter 2026 reported results. Source: JD.com first-quarter 2026 results, p. 1.
07

Customers, Merchants and Geography

Public disclosures support customer types, channels and selected counterparties; they do not support a complete customer roster or private contract economics.

RelationshipRoleCompany relevance
Consumers in ChinaPrimary retail customer baseHousehold demand, disposable income, confidence, product mix, price sensitivity, service quality and repeat purchasing directly affect retail sales and promotional intensity.
Third-party business customersExternal logistics customer baseExternal demand diversifies logistics revenue and improves network utilization. Contract pricing, customer retention, service commitments and concentration determine whether that growth improves profitability.
third-party merchantsMarketplace seller baseMerchant breadth improves assortment and capital efficiency. Merchant quality, pricing, advertising spend, compliance, fraud prevention and retention influence marketplace revenue and consumer trust.
Mainland ChinaPrincipal operating marketChinese consumption, e-commerce policy, platform regulation, labor conditions, logistics access and competitive behavior shape the group's near-term operating performance.
JD Logistics frontline employees handling customer deliveries
JD Logistics frontline employees handling customer deliveries. Source: JD.com official media library.
JD Logistics operates a branded delivery fleet as part of its integrated network
JD Logistics operates a branded delivery fleet as part of its integrated network. Source: JD.com official media library.
08

Fulfilment and Supply Chain

Asset, input or providerRoleOperational significance
JD warehouse networkNationwide fulfillment infrastructureThis infrastructure supports inventory availability and delivery speed. Utilization, automation, lease and labor costs, disruption resilience, inventory placement and third-party capacity quality determine whether scale converts into margin.
Third-party couriers and cloud-warehouse operatorsSupplementary fulfillment providersExternal capacity improves flexibility but introduces service-quality, data, labor, pricing and continuity risks. The public evidence describes provider categories, not a complete roster or private contract terms.
JD LogisticsIntegrated logistics and supply-chain segmentNetwork density and utilization can create service quality and cost advantages, but warehouses, riders and delivery capacity have substantial fixed and variable costs. External-customer growth and internal demand determine operating leverage.
Domestic and cross-border manufacturers, distributors and resellersFirst-party retail supplier baseAvailability, purchase pricing, payment terms, product quality and supplier continuity affect retail revenue, inventory and gross margin. Public filings describe supplier types and risks but do not disclose a complete supplier roster or private commercial terms.
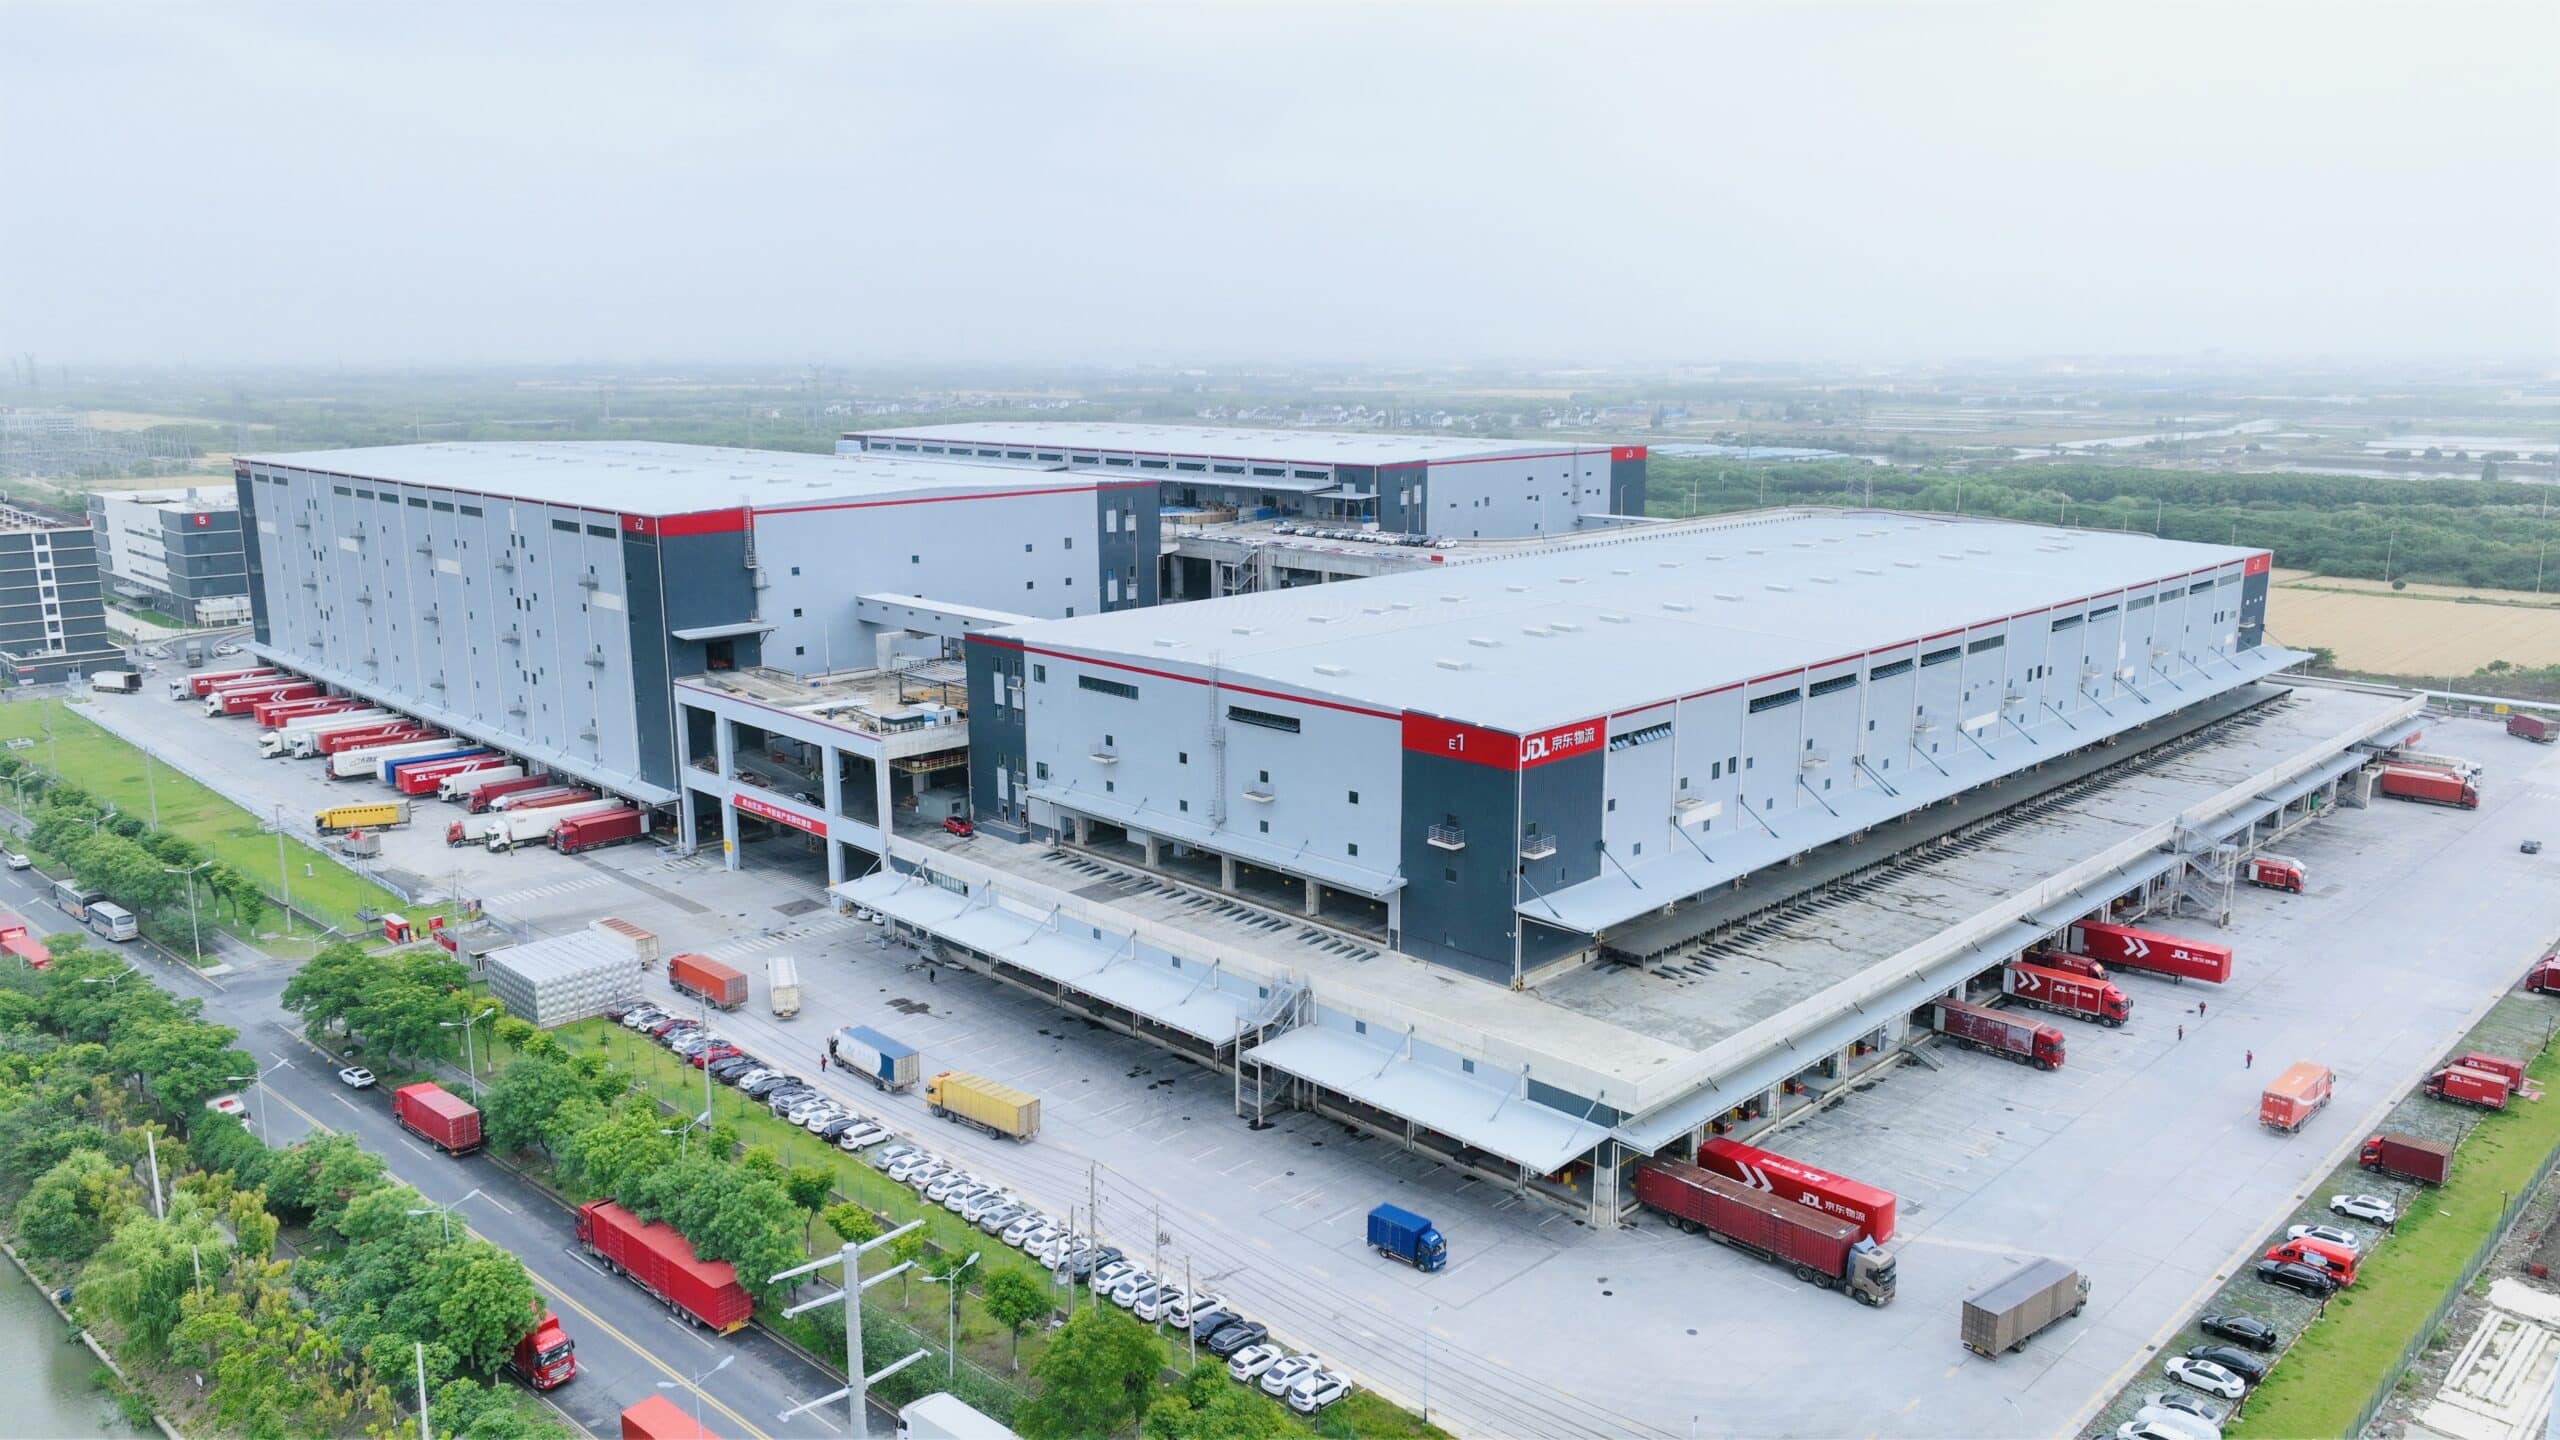
JD Logistics Kunshan Asia No.1 intelligent logistics park
JD Logistics Kunshan Asia No.1 intelligent logistics park. Source: JD.com official media library.
Robotic handling equipment inside JD's Kunshan logistics park
Robotic handling equipment inside JD's Kunshan logistics park. Source: JD.com official media library.
JD's fulfilment infrastructure and operating model
JD's fulfilment infrastructure and operating model. Source: JD.com Annual Report 2025, p. 32.
09

Historical Financials

PeriodRevenueEBITDANet incomeEPS
FY2023CNY 1,084,662.0mCNY 37,202.0mCNY 24,167.0m7.62
FY2024CNY 1,158,819.0mCNY 48,474.0mCNY 41,359.0m13.45
FY2025CNY 1,309,085.0mCNY 36,644.0mCNY 19,600.0m6.45
Revenue history and forecast0467,500935,0001,402,5001,870,000FY23FY24FY25FY26FY27FY28FY29FY30Revenue
Solid line combines reported history and analyst forecasts; the boundary is identified in the table and methodology.
EPS history and forecast05101520FY23FY24FY25FY26FY27FY28FY29FY30EPS
Per-share history follows the stated share basis in the source records.
FY2025 financial and operating results
FY2025 financial and operating results. Source: JD.com fourth-quarter and full-year 2025 results, p. 1.
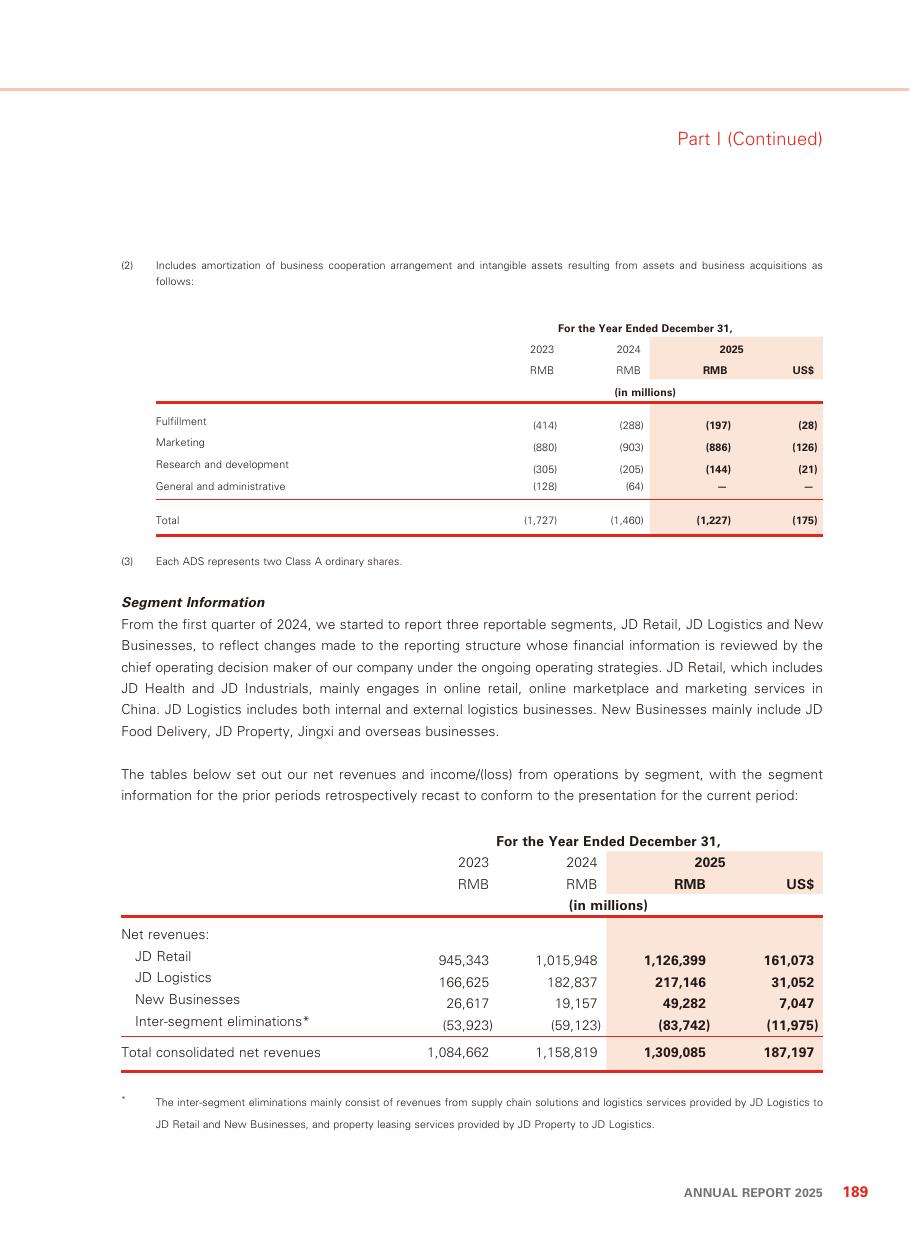
Three-year Revenue composition and fulfilment expense
Three-year Revenue composition and fulfilment expense. Source: JD.com Annual Report 2025, p. 189.
10

Forecast Framework

A statistical control and a separate analyst driver model are kept visible.

Revenue = demand x addressable exposure x order conversion x capacity realizationEBITDA = Revenue x EBITDA marginEPS = Net income / diluted sharesFCFF = EBIT x (1 - tax) + D&A - capex - change in working capital

Point-in-time control model

MetricSelected modelPeriodsWAPEBiasInterval coverage
GAAP diluted EPSrobust_ensemble1551.7%-3.0%66.7%
Net incomerobust_ensemble1550.0%6.1%60.0%
Revenueseasonal_naive157.2%-7.2%73.3%

The control is selected through expanding-window backtesting. Small samples make these diagnostics descriptive rather than conclusive. The annual analyst case uses operating evidence and does not overwrite the frozen control.

Next reported period

PeriodRevenueGAAP EPSModelBasis
FY2026 Q2CNY 344,000.0m2.30Analyst driver bridgeQ1 trading, seasonal control, retail category growth and continued food-delivery investment

Annual assumption bridge

YearRevenue growthEBITDA marginNet marginCapex / revenueBasis
FY20263.9%2.9%1.8%1.2%Retail growth and logistics demand offset by a deliberately conservative loss allowance for food delivery and newer initiatives
FY20276.2%3.4%2.4%1.2%Retail and logistics continue growing while New Businesses losses narrow; repurchases reduce the diluted share base
FY20285.9%3.9%2.7%1.1%Fulfilment utilization and service mix improve, without assuming New Businesses reaches mature retail margins
FY20295.6%4.2%2.9%1.1%Mid-single-digit group growth with a more stable mix of marketplace, logistics and first-party retail earnings
FY20305.3%4.4%3.0%1.1%Steady-state case; competitive intensity prevents an indefinite margin expansion assumption
11

Financial Forecasts

YearRevenueEBITDAEBITNet incomeEPSFCFF
FY2026CNY 1,360,000.0mCNY 39,440.0mCNY 28,560.0mCNY 25,024.0m8.54CNY 8,676.8m
FY2027CNY 1,445,000.0mCNY 49,130.0mCNY 37,570.0mCNY 33,957.5m11.79CNY 16,299.6m
FY2028CNY 1,530,000.0mCNY 59,670.0mCNY 47,430.0mCNY 41,310.0m14.60CNY 24,755.4m
FY2029CNY 1,615,000.0mCNY 67,830.0mCNY 54,910.0mCNY 46,835.0m16.79CNY 31,524.8m
FY2030CNY 1,700,000.0mCNY 74,800.0mCNY 61,200.0mCNY 51,000.0m18.48CNY 35,836.0m
Revenue history and forecast0467,500935,0001,402,5001,870,000FY23FY24FY25FY26FY27FY28FY29FY30Revenue
Revenue forecast with the research-cut boundary disclosed in the table.
Forecast margins0%1%2%4%5%FY26FY27FY28FY29FY30EBITDA marginNet margin
Margins are not held at a peak indefinitely; the model allows normalization as industry capacity expands.

EPS follows modeled net income and diluted shares without a manual override; the full series is shown in the table above.

12

Valuation

The target blends a forward earnings multiple with a lower-weight DCF cross-check.

MethodKey assumptionValue per shareWeight
Forward P/EFY2027 EPS 11.79 at 11.0xHKD 14180.0%
DCFWACC 10.5%; terminal growth 3.0%HKD 15520.0%
Blended targetRounded under house policyHKD 144100.0%

DCF sensitivity

WACC / g2.0%2.5%3.0%3.5%4.0%
8.5%HKD 184HKD 196HKD 210HKD 227HKD 248
9.5%HKD 159HKD 168HKD 178HKD 190HKD 204
10.5%HKD 141HKD 147HKD 155HKD 163HKD 172
11.5%HKD 126HKD 131HKD 137HKD 143HKD 150
12.5%HKD 114HKD 118HKD 122HKD 127HKD 133

Scenarios

ScenarioProbabilityEPS factorP/ETargetReturnCase
Bear25.0%0.72x8.0xHKD 74.00-42.9%Food-delivery losses remain elevated while consumption and category competition limit retail margin.
Base55.0%1.00x11.0xHKD 1419.1%JD Retail and logistics grow steadily and New Businesses losses narrow, but do not disappear immediately.
Bull20.0%1.18x14.0xHKD 21263.9%Delivery density improves faster, marketplace mix strengthens and repurchases magnify per-share earnings recovery.
Scenario valuation range06012118124274.0Bear141.0Base212.0Bull
Scenario target prices are deterministic outputs of the disclosed EPS factors and valuation multiples.

DCF terminal value and the chosen P/E multiple are assumptions, not observed facts. The rating remains pending analyst approval.

13

Scenarios, Catalysts and Risks

Risk probability and impact matrixProbabilityImpactLowLowMediumMediumHighHigh1New-business investment rema...2Retail and platform competit...3Supplier terms and product a...4Fulfilment underutilization ...
Risk positions reflect the probability and impact labels in the reviewed risk register; they are not statistical event probabilities.

New-business investment remains structurally loss-making

Medium-High probability / High impact. Subsidies, rider capacity and customer acquisition can absorb JD Retail profit before order density supports acceptable unit economics.

Valuation impact: A RMB10bn reduction in FY2027 net income lowers EPS by about RMB3.47 and the 11x P/E indication by roughly HKD41 per share before any multiple response.

Mitigation: Management has financial capacity and reported sequential loss narrowing in Q1 2026, but the timing and scale of breakeven remain uncertain.

Retail and platform competition

High probability / High impact. Lower prices, promotions, marketing and faster delivery investment can support share while reducing merchandise and group margin.

Valuation impact: A 50 bp FY2027 net-margin shortfall reduces modeled EPS by roughly RMB2.51 and the P/E indication by about HKD30 per share.

Mitigation: First-party sourcing, service quality, marketplace breadth and fulfilment density differentiate JD, but none removes price competition.

Supplier terms and product availability

Medium probability / Medium-High impact. First-party retail depends on adequate inventory, authentic products and commercially acceptable supplier pricing and payment terms.

Valuation impact: A 50 bp gross-margin shock would reduce annual gross profit by roughly RMB6.8bn on FY2026 Revenue before offsets.

Mitigation: Scale, data and supplier relationships support procurement, while framework agreements do not guarantee future availability or pricing.

Fulfilment underutilization and operating disruption

Medium probability / High impact. Warehouse, labor and delivery capacity carry fixed and semi-fixed costs; disruption or weak utilization can affect both customer experience and margin.

Valuation impact: A 100 bp EBITDA-margin shortfall reduces FY2027 EBITDA by about RMB14.5bn and weakens the DCF cross-check.

Mitigation: Network scale, automation and external logistics demand diversify utilization, but the infrastructure remains operationally complex.

Catalyst register

CatalystTimingEvidence to watchFinancial link
Second-quarter 2026 resultsAugust 2026JD Retail margin, New Businesses loss, food-delivery order density and group cash flowRevenue, operating margin and EPS
New Businesses loss trajectoryEach quarterly resultSequential operating loss, subsidy intensity and rider productivityOperating income and EPS
JD Logistics external growthQuarterly and annual reportingExternal customer revenue, margin, warehouse utilization and capexRevenue, EBITDA and FCFF
Share repurchasesOngoing through the authorized programShares purchased, average price and remaining authorizationDiluted shares and per-share value

No separate event-intelligence layer was frozen for this initiation. Reported results and disclosed operating developments are reflected only through the dated source ledger and analyst assumptions.

14

Capital Allocation and Governance

Capital allocation

The model gives priority to balance-sheet capacity, reinvestment needs and cash conversion. Net cash is added in DCF, but only once; it is not also capitalized through the earnings multiple.

Expansion capex is explicitly deducted from FCFF in the year it is expected to be spent. A project can be strategically attractive and still reduce near-term free cash flow.

Governance stance

Reported actuals, research-cut dates, evidence hashes and approved ratings are outside the chatbot edit surface. Narrative and assumptions may change only through a validated, versioned patch.

Private contracts, complete customer rosters and undisclosed order economics remain unknown rather than estimated as facts.

Comparable-company screen

CompanyWhy includedHow used
Alibaba GroupMarketplace, retail and local-services peerConsumer demand, merchant monetization and local-services economics; business mix differs
PDD HoldingsValue-oriented marketplace competitorPrice competition, merchant participation and marketing intensity
MeituanLocal commerce and food-delivery competitorOrder density, rider economics and subsidy discipline
SF HoldingChinese logistics and express-delivery peerLogistics utilization, service mix and capital intensity
15

Methodology, Sources and Disclosures

Evidence classes

Reported: official filing or exchange disclosure. Derived: deterministic calculation from reported figures. Forecast: model output using disclosed assumptions. Judgment: analyst interpretation. Scenario: bounded alternative, not a prediction.

Source ledger

SourceDateUseStatus
JD.com Annual Report 20252026-04-16Audited financials, segments, operations, subsidiaries, suppliers and risk factorsavailable
JD.com fourth-quarter and full-year 2025 results2026-03-05FY2025 results and management commentaryavailable
JD.com first-quarter 2026 results2026-05-12Latest reported Revenue, segment progress, repurchases and new-business commentaryavailable
FMP structured market and financial snapshot2026-08-04Reference price, market capitalization, balance-sheet normalization and consensus cross-checkavailable
Argus JD point-in-time statistical forecast control2026-08-04Expanding-window backtest and frozen Revenue/EPS controlavailable
Argus verified JD.com company-twin release2026-07-26Evidence-backed operating relationships, risks and driversavailable
JD.com official media library2026-08-04First-party operating, logistics, retail and corporate photographyavailable
Supplier rebates, delivery unit economics and complete customer contractsKnown data gapknown_gap

Forecast governance

The point-in-time statistical baseline is frozen before event scenarios. Annual estimates use an explicit revenue-to-margin-to-EPS bridge. Events do not change the control forecast automatically; they create reviewable low/high deltas and require promotion into a new immutable version.

Limitations

  • Backtest histories are short and do not support strong claims of future accuracy.
  • Public disclosures do not reveal every customer, supplier, contract term or product-level margin.
  • Provider and extracted data are supporting evidence; official documents take precedence.
  • Valuation is sensitive to terminal growth, discount rates, multiples and the timing of operational assumptions.