YesAsia Holdings Limited

Initiation of coverage

YesAsia Holdings Limited

K-Beauty demand has scale; fulfilment and customer economics decide the margin

2209.HKHong Kong Stock ExchangeCross-border beauty e-commerce and distribution2026-07-30
Evidence-backed research POC. Model indication: BUY; target HKD 5.50. Rating pending analyst approval.

Contents

Research cut 2026-07-30T23:59:59+08:00. Report figures are model outputs unless explicitly labelled reported or preliminary.

01

Investment Summary

K-Beauty demand has scale; fulfilment and customer economics decide the margin

RatingBUY
Target priceHKD 5.50
Reference priceHKD 3.37
Implied return63.2%

YesAsia has grown from a cross-border retail platform into a combined B2C and wholesale distribution network. The opportunity is supported by K-Beauty adoption, geographic diversification and ABW's offline expansion. The investment case depends on converting that demand into repeat orders, disciplined acquisition cost and reliable fulfilment without allowing inventory and freight to absorb the benefit.

What matters

Two channels now carry the growth case

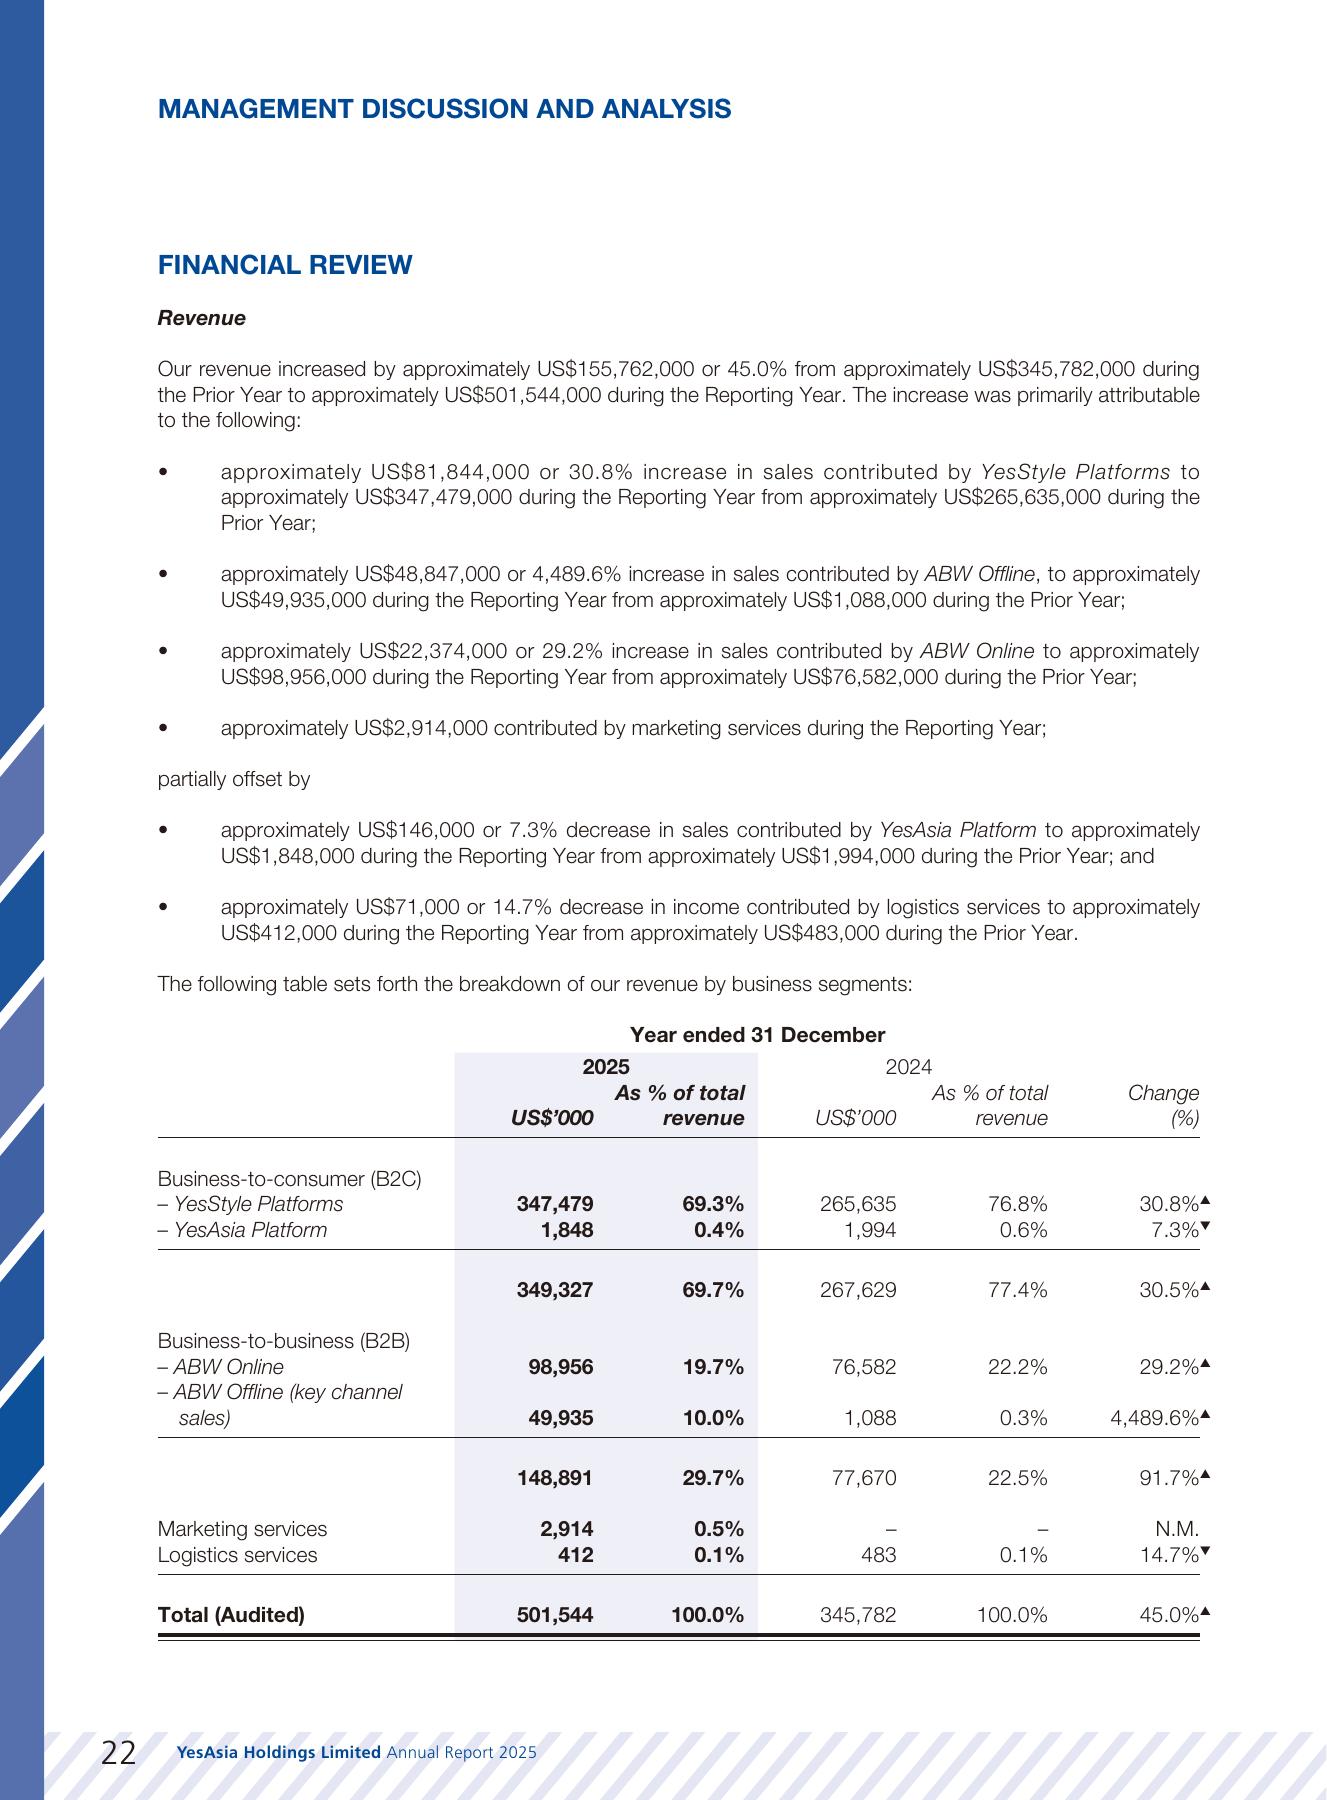
YesStyle gives the group a direct retail relationship, while ABW extends the same brand and logistics infrastructure into wholesale. FY2025 ABW revenue increased 91.7% to USD 148.9m and its new offline channel contributed USD 49.9m, reducing dependence on one route to market.

YesAsia Holdings Annual Report 2025

Demand is visible; conversion quality is the harder question

FY2025 revenue rose 45.0% and preliminary H1 2026 revenue rose 23.6%. The forecast therefore does not depend on discovering demand. It depends on repeat purchase, marketing efficiency, product availability and freight economics converting growth into a durable margin.

YesAsia H1 2026 positive profit alert

The logistics build can create leverage or working-capital drag

Two Hong Kong AMR warehouses, a South Korea facility and outsourced Western warehouses expand capacity. The same model requires more inventory, receivables and local operating cost, so fulfilment accuracy and cash conversion must improve together.

YesAsia Holdings Annual Report 2025

The valuation leaves room for execution, but the evidence base is short

Our target uses a restrained FY2027 earnings multiple and a lower-weight DCF. The current statistical controls have only six semiannual observations, so the annual case is presented as an explicit analyst bridge rather than a high-confidence machine forecast.

Derived model output

Share-price history024682025-012025-032025-042025-062025-072025-092025-102025-122026-012026-032026-042026-062026-072026-07Share price
Reference-price history. The valuation date is fixed; subsequent prices are not included.
PeriodRevenueGrowthEBITDA marginEPS
FY2026USD 650.0m29.6%8.2%0.08
FY2027USD 790.0m21.5%9.1%0.12
FY2028USD 930.0m17.7%9.8%0.15

The rating is a model indication pending analyst approval. It is not personalized investment advice.

02

Thesis and Variant View

The variant view is about conversion, not the existence of demand.

Two channels now carry the growth case

YesStyle gives the group a direct retail relationship, while ABW extends the same brand and logistics infrastructure into wholesale. FY2025 ABW revenue increased 91.7% to USD 148.9m and its new offline channel contributed USD 49.9m, reducing dependence on one route to market.

Demand is visible; conversion quality is the harder question

FY2025 revenue rose 45.0% and preliminary H1 2026 revenue rose 23.6%. The forecast therefore does not depend on discovering demand. It depends on repeat purchase, marketing efficiency, product availability and freight economics converting growth into a durable margin.

The logistics build can create leverage or working-capital drag

Two Hong Kong AMR warehouses, a South Korea facility and outsourced Western warehouses expand capacity. The same model requires more inventory, receivables and local operating cost, so fulfilment accuracy and cash conversion must improve together.

The valuation leaves room for execution, but the evidence base is short

Our target uses a restrained FY2027 earnings multiple and a lower-weight DCF. The current statistical controls have only six semiannual observations, so the annual case is presented as an explicit analyst bridge rather than a high-confidence machine forecast.

03

Business Model

YesAsia sells Asian beauty, fashion, lifestyle and entertainment products globally. YesStyle serves retail consumers through web and mobile channels, while AsianBeautyWholesale supplies online and offline business customers. The group combines direct digital demand generation, influencer marketing, brand distribution relationships and a multi-country warehouse network.

Business lineWhat it doesPrimary earnings driver
YesStyleGlobal B2C e-commerce platforms and mobile apps selling beauty, fashion and lifestyle products.Active customers, orders, average order value, mobile conversion and acquisition cost
ABW OnlineOnline wholesale platform serving resellers and other business customers sourcing Asian beauty products.B2B customer count, order size, repeat orders and gross margin
ABW OfflineDirect distribution to large retail chains and other offline channels across multiple markets.Retailer rollout, sell-through, receivables and inventory turns
YesAsiaLegacy cross-border platform focused on Asian entertainment and related products.Niche demand, catalogue availability and fulfilment cost
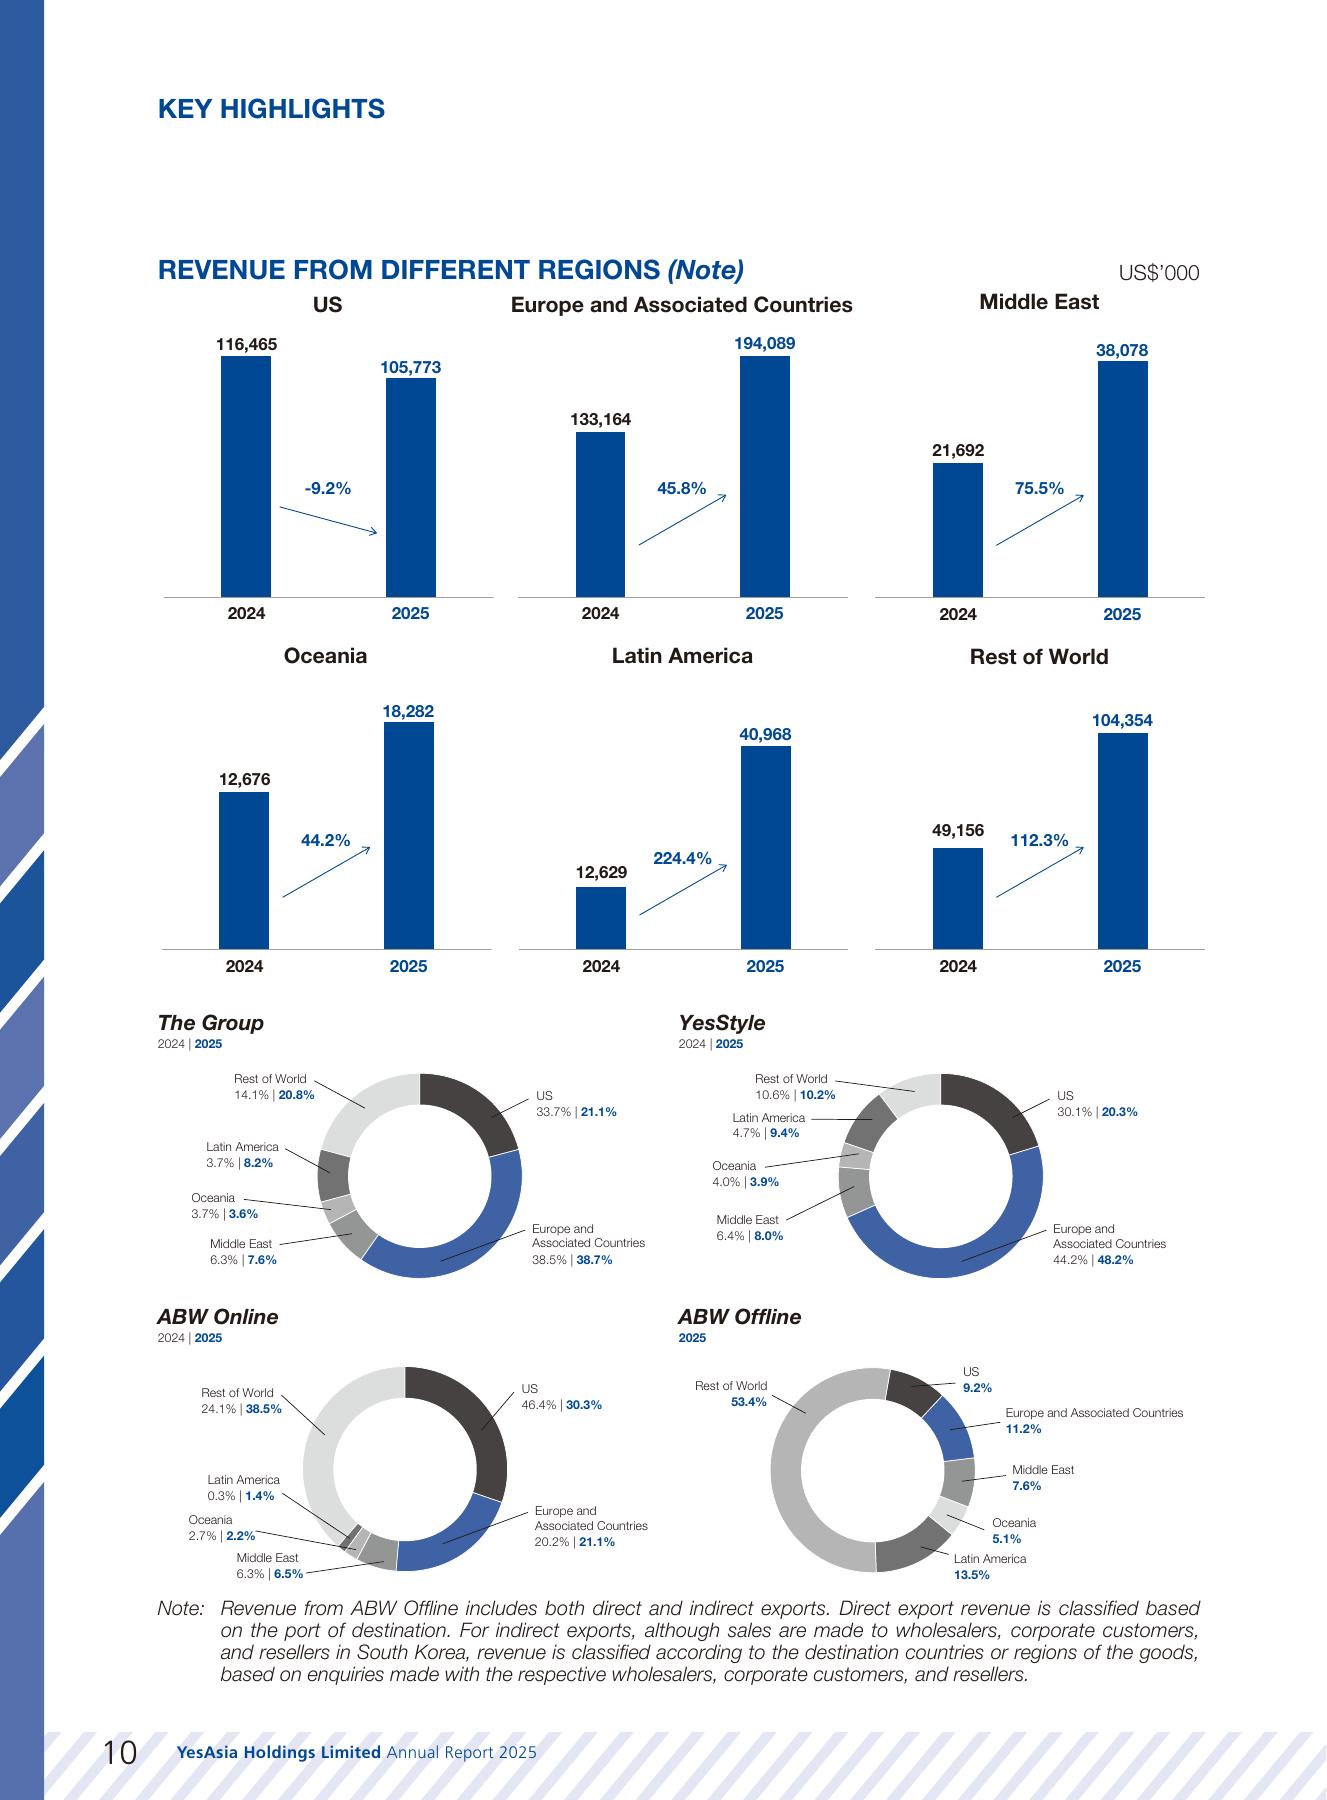
FY2025 regional growth and business-channel mix
FY2025 regional growth and business-channel mix. Source: YesAsia Holdings Annual Report 2025, p. 10.
FY2025 B2C, B2B and marketing-services revenue bridge
FY2025 B2C, B2B and marketing-services revenue bridge. Source: YesAsia Holdings Annual Report 2025, p. 22.
04

Company Operating Map

A compact view of how products, capacity, counterparties and risks connect to the financial model.

Reviewed company operating mapYesAsia Holdings Limited - Exposed To Risk Factor - Inventory obsolescence and markdown riskYesAsia Holdings Limited - Operates Facility - Goodman Interlink AMR WarehouseYesStyle - Operates Facility - Yesful LandYesAsia Holdings Limited - Operates Facility - Mapletree Smart Robotics WarehouseYesAsia Holdings Limited - Has Business Driver - Beauty-brand assortmentYesAsia Holdings Limited - Has Business Driver - Non-core market expansionYesAsia Holdings Limited - Has Geographic Revenue Exposure - OceaniaYesStyle - Offers Product Or Platform - Fashion and lifestyle productsYesStyle - Strategic Partner - COSRXYesStyle - Offers Product Or Platform - Beauty productsYesAsia Holdings Limited - Has Geographic Revenue Exposure - Latin AmericaYesAsia Holdings Limited - Exposed To Risk Factor - Foreign-exchange volatilityYesStyle - Serves Customer Type - Global retail consumersAsianBeautyWholesale - Serves Customer Type - Global beauty retailers and resellersYesAsia Holdings Limited - Has Business Driver - Influencer referral trafficAsianBeautyWholesale - Operates Business - ABW OfflineYesAsia Holdings Limited - Exposed To Risk Factor - Cross-border logistics and fulfilment disruptionYesAsia Holdings Limited - Has Geographic Revenue Exposure - Rest of WorldYesAsia Holdings Limited - Exposed To Risk Factor - Digital customer-acquisition costYesAsia Holdings Limited - Has Business Driver - Global adoption of K-BeautyYesAsia Holdings Limited - Purchases From Supplier - K-Beauty brand partnersYesAsia - Offers Product Or Platform - Asian entertainment productsAsianBeautyWholesale - Serves Customer - PrimarkYesAsia Holdings Limited - Has Geographic Revenue Exposure - Middle EastYesAsia Holdings Limited - Exposed To Risk Factor - Tariff and trade-policy exposureAsianBeautyWholesale - Operates Business - ABW OnlineYesAsia Holdings Limited - Strategic Partner - CN Logistics International Holdings LimitedYesAsia Holdings Limited - Operates Business - YesStyleYesAsia Holdings Limited - Has Business Driver - Mobile-app adoptionYesAsia Holdings Limited - Operates Business - YesAsiaYesAsia Holdings Limited - Operates Business - AsianBeautyWholesaleYesAsia Holdings Limited - Has Geographic Revenue Exposure - Europe and Associated CountriesYesAsia46 nodes / 47 linksAsianBeautyWholesaleYesStyleYesAsiaABW OfflineABW OnlineAsian entertainment pro...Beauty productsFashion and lifestyle p...CN Logistics Internatio...COSRXGlobal beauty retailers...Global retail consumersPrimarkGoodman Interlink AMR W...Mapletree Smart Robotic...Yesful LandK-Beauty brand partnersEurope and Associated C...Latin AmericaMiddle EastOceaniaRest of WorldBeauty-brand assortmentGlobal adoption of K-Be...Influencer referral tra...Mobile-app adoptionNon-core market expansionCross-border logistics ...Digital customer-acquis...Foreign-exchange volati...Inventory obsolescence ...Tariff and trade-policy...
Reviewed presentation graph. No relationship is inferred solely to increase density.
Driver to financial metric mapBusiness driversFinancial compartmentsForecast metricsGlobal adoption of K-BeautyYesStyle customer acquisition and...ABW online and offline wholesale ...K-Beauty brand assortment and ava...Warehouse automation and fulfilme...Geographic mix, trade policy and ...Beauty revenueRevenueOrder volumeB2C revenueMarketing expenseOperating marginB2B revenueRevenueAdjusted EPSGAAP EPS
Driver paths describe a financial mechanism, not proven causality. Only reviewed driver-to-financial mappings enter the forecast; a graph connection alone never creates an earnings adjustment.
05

Industry and Demand

K-Beauty adoption is broadening beyond the United States and core English-speaking markets. In FY2025, non-core markets generated 63.6% of group revenue and grew 83.9% year on year.

Wholesale distribution expands the addressable market beyond online consumers, but introduces different economics: larger orders and retail reach alongside receivables, inventory commitments and customer concentration.

Cross-border beauty retail is operationally demanding. Brand availability, localization, duties, freight, returns and delivery time influence conversion and gross margin as much as headline category growth.

Influencer and mobile channels are measurable demand engines rather than branding abstractions. FY2025 influencer-referred revenue reached USD 104.8m and mobile-app revenue reached USD 178.7m.

Reviewed driver importance0%28%55%83%111%97.0%Global adoption of94.0%YesStyle customer 92.0%ABW online and off87.0%K-Beauty brand ass84.0%Warehouse automati82.0%Geographic mix, tr76.0%Inventory availabi
Monitoring priorities derived from filings, operating disclosures and the reviewed company graph.
06

Platforms and Product Portfolio

Product or marketRoleWhy it matters
ABW OfflineDirect wholesale distribution channelThe channel extends YesAsia into the much larger offline beauty market and produces sizable orders, but introduces account concentration, credit and inventory-planning exposure.
ABW OnlineOnline wholesale channelCustomer count, average order value, repeat purchasing, assortment and fulfilment determine channel growth and working-capital efficiency.
AsianBeautyWholesaleGlobal business-to-business wholesale platformABW broadens the group beyond direct retail, creates materially larger order values and exposes results to wholesale demand, inventory availability and fulfilment execution.
YesAsiaAsian entertainment e-commerce platformIt is a smaller revenue contributor than beauty, but retains strategic value through the group's original brand, content catalogue and specialist customer base.
YesStyleGlobal business-to-consumer platformIts customer base, order frequency, average order value, app adoption, assortment and digital-acquisition economics are central drivers of group revenue and gross profit.
Asian entertainment productsSpecialist product portfolioIt serves a specialist international audience and is economically smaller than the group's beauty-led operations.
Beauty productsPrimary product portfolioBeauty represents the dominant share of group revenue, so assortment, brand access, product availability, consumer trends and regulatory compliance directly affect growth and gross margin.
Fashion and lifestyle productsConsumer product portfolioIt diversifies the consumer proposition but contributes less revenue than beauty; inventory turns, trend relevance and markdown discipline determine its economic contribution.
FY2025 B2C, B2B and marketing-services revenue bridge
FY2025 B2C, B2B and marketing-services revenue bridge. YesAsia Holdings Annual Report 2025.
07

Customers, Channels and Geography

Public disclosures support customer types, channels and selected counterparties; they do not support a complete customer roster or private contract economics.

RelationshipRoleCompany relevance
CN Logistics International Holdings LimitedStrategic cross-border logistics partnerThe relationship supports delivery to the United States, Europe and other markets; YesAsia also holds a small equity investment intended to reinforce the partnership.
COSRXK-beauty brand collaboration partnerThe programme illustrates how YesAsia combines brand access, influencers and localized demand generation rather than acting only as a product reseller.
PrimarkEuropean retail distribution channelThe relationship supports offline retail reach as K-beauty adoption broadens across Europe, although relationship-level sales are not disclosed.
RossmannEuropean health-and-beauty retail channelIts store network can expand K-beauty distribution in continental Europe, where YesAsia reports strong regional growth.
Sally BeautyLatin American beauty retail channelThe relationship supports market diversification into a region that recorded rapid revenue growth in 2025.
Target CorporationNorth American retail distribution channelLarge offline retailers broaden brand reach and wholesale volume; public disclosure does not quantify revenue attributable to this relationship.
Ulta BeautyNorth American beauty retail channelA specialist beauty chain provides direct access to category-focused consumers, but YesAsia does not disclose relationship-level sales.
Global beauty retailers and resellersWholesale customer baseWholesale customers generate larger average orders, but demand can be more concentrated and sensitive to inventory availability, cross-border freight and downstream retail conditions.
Global retail consumersDirect-to-consumer customer baseCustomer growth, retention, conversion, order frequency and basket size translate directly into transaction volume and platform revenue.
Europe and Associated CountriesLargest FY2025 revenue regionMultilingual sites, influencer campaigns and offline retail channels support growth, while VAT, consumer regulation and cross-border logistics shape execution.
Latin AmericaRapidly expanding regional marketThe region is a material diversification driver, with currency, freight and local-market execution affecting profitability.
Middle EastHigh-growth regional marketStrong growth provides diversification, while logistics, localization, duties and geopolitical conditions remain relevant.
OceaniaEstablished regional marketThe region provides diversification but is smaller than Europe, the United States and the faster-growing non-core markets.
Rest of WorldDiversified international revenue poolIts scale shows the breadth of the platform, but the aggregation limits country-level exposure analysis.
United StatesMajor revenue marketIt remains material to revenue but declined as a share in 2025, making tariff policy, customer acquisition and local fulfilment important operating variables.
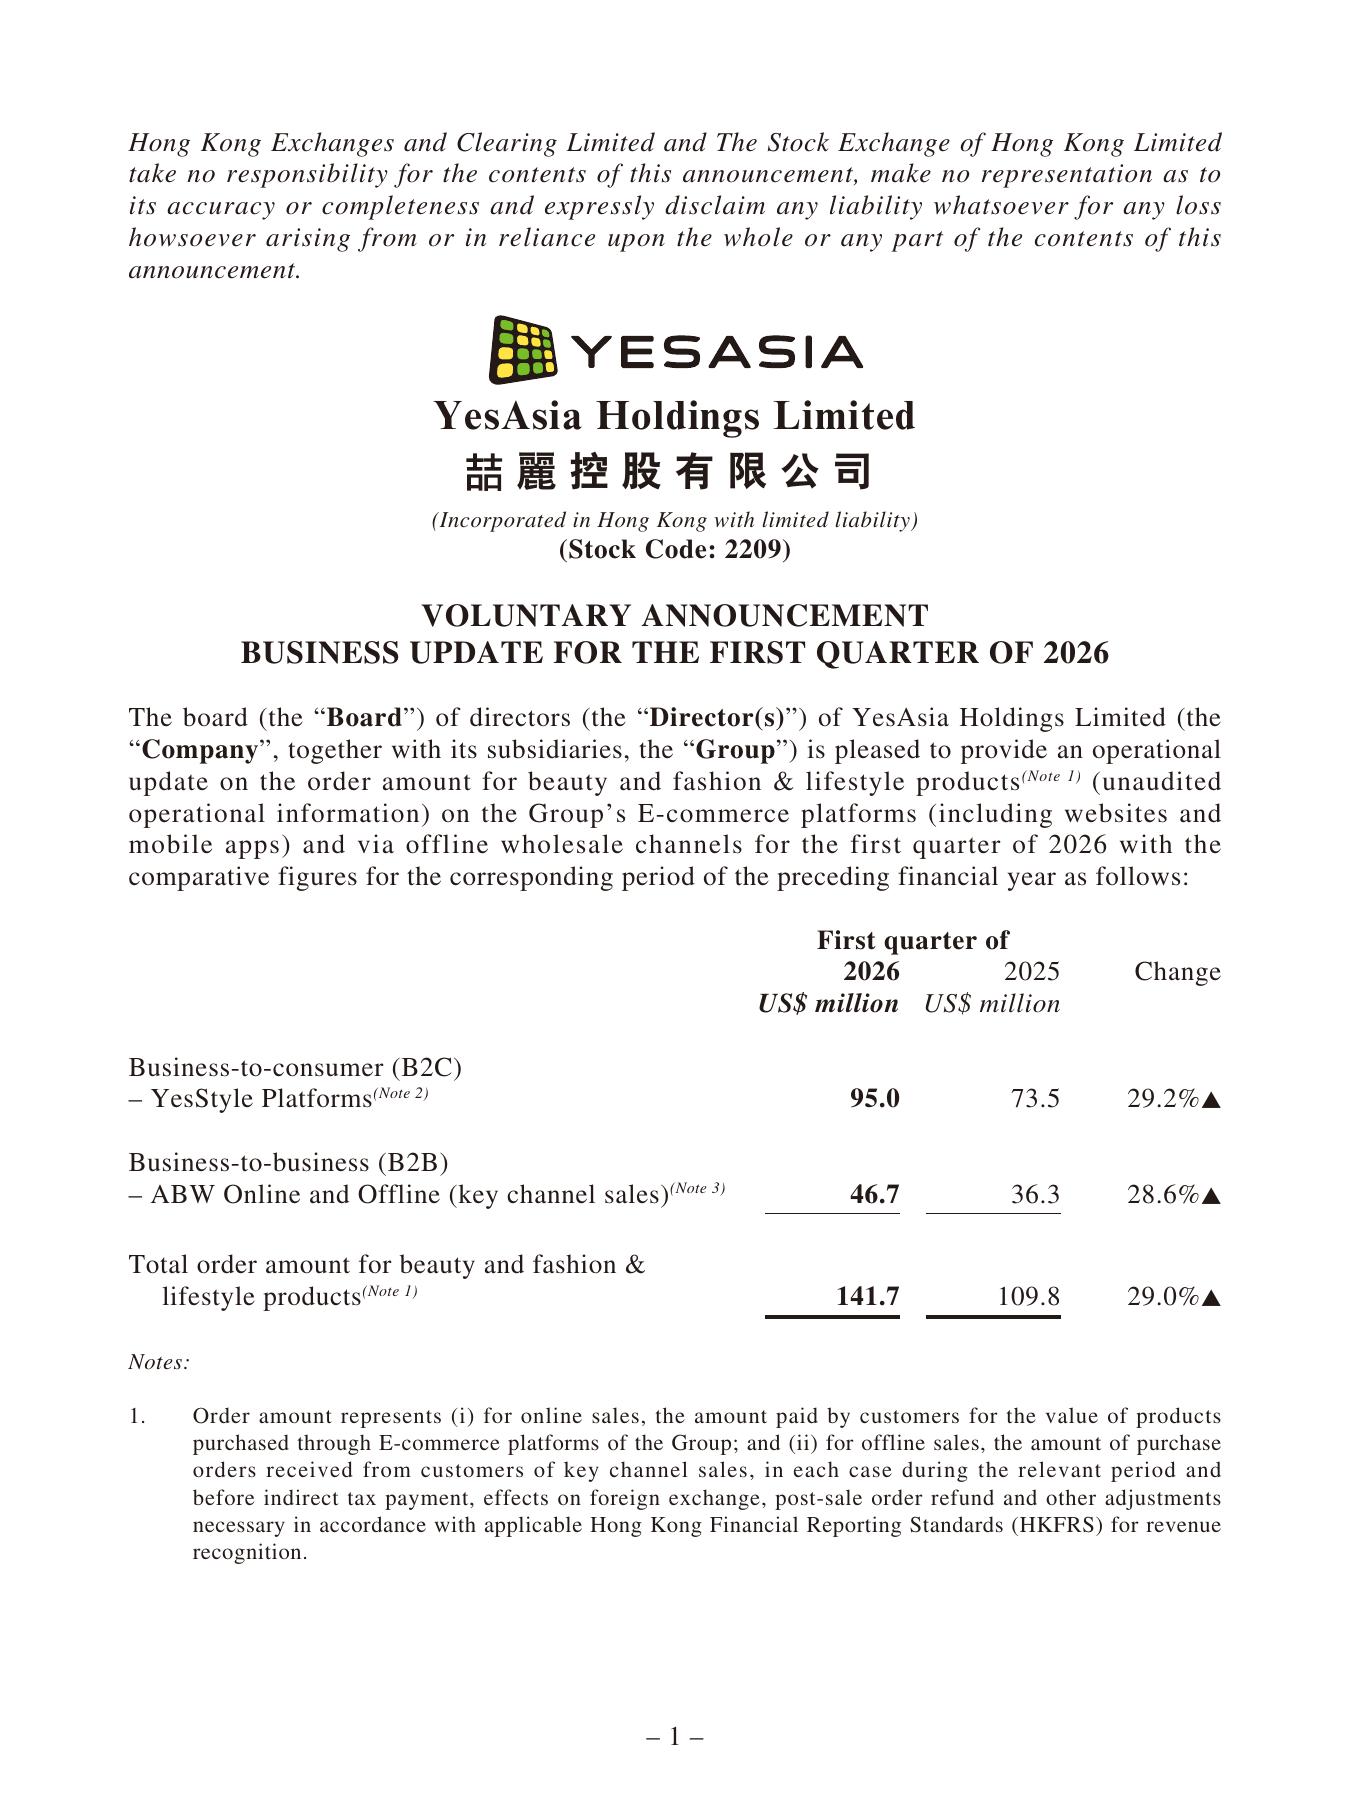
First-quarter 2026 B2C and B2B order-value update
First-quarter 2026 B2C and B2B order-value update. YesAsia first-quarter 2026 business update.
08

Brands, Inventory and Fulfilment

Asset, input or providerRoleOperational significance
Goodman Interlink AMR WarehouseFirst Hong Kong automated warehouseTogether with Mapletree, it provides the core Hong Kong fulfilment capacity and supports faster, more accurate order processing.
Mapletree Smart Robotics WarehouseAutomated fulfilment facilityWarehouse throughput, automation productivity, capacity utilization and operational continuity influence delivery speed, labour efficiency and the group's ability to scale order volumes.
Yesful LandSeoul brand-experience and content venueIt extends the brand beyond e-commerce and supports community building and social content, though its direct financial contribution is not separately disclosed.
K-Beauty brand partnersBeauty-brand supply and distribution networkBrand access and in-stock assortment are central to product availability, conversion and wholesale demand; the complete roster and individual commercial terms are not publicly disclosed.
09

Historical Financials

PeriodRevenueEBITDANet incomeEPS
FY2023USD 201.3mUSD 15.5mUSD 7.6m0.02
FY2024USD 345.8mUSD 26.4mUSD 19.1m0.05
FY2025USD 501.5mUSD 34.4mUSD 23.2m0.06
Revenue history and forecast03246499741,298FY23FY24FY25FY26FY27FY28FY29FY30Revenue
Solid line combines reported history and analyst forecasts; the boundary is identified in the table and methodology.
EPS history and forecast00000FY23FY24FY25FY26FY27FY28FY29FY30EPS
Per-share history follows the stated share basis in the source records.
10

Forecast Framework

A statistical control and a separate analyst driver model are kept visible.

Revenue = demand x addressable exposure x order conversion x capacity realizationEBITDA = Revenue x EBITDA marginEPS = Net income / diluted sharesFCFF = EBIT x (1 - tax) + D&A - capex - change in working capital

Point-in-time control model

MetricSelected modelPeriodsWAPEBiasInterval coverage
GAAP diluted EPSseasonal_naive659.9%-59.9%100.0%
Net incomerobust_ensemble658.9%-13.9%66.7%
Revenuerobust_ensemble616.4%-11.9%66.7%

The control is selected through expanding-window backtesting. Small samples make these diagnostics descriptive rather than conclusive. The annual analyst case uses operating evidence and does not overwrite the frozen control.

Annual assumption bridge

YearRevenue growthEBITDA marginNet marginCapex / revenueBasis
FY202629.6%8.2%5.5%2.0%H1 preliminary revenue and profit, Q1 order growth and a moderated second-half run-rate
FY202721.5%9.1%6.2%1.8%B2B channel expansion, broader regional demand and fuller warehouse utilization
FY202817.7%9.8%6.7%1.7%Slower growth with operating leverage, offset by continued marketing and fulfilment investment
FY202914.0%10.1%6.9%1.6%Maturing B2C and B2B channels with normalized customer-acquisition economics
FY203011.3%10.3%7.0%1.6%Steady-state cross-border growth with no assumption of peak pandemic-style e-commerce margins
11

Financial Forecasts

YearRevenueEBITDAEBITNet incomeEPSFCFF
FY2026USD 650.0mUSD 53.3mUSD 46.1mUSD 35.8m0.08USD 11.1m
FY2027USD 790.0mUSD 71.9mUSD 63.2mUSD 49.0m0.12USD 24.6m
FY2028USD 930.0mUSD 91.1mUSD 80.9mUSD 62.3m0.15USD 37.9m
FY2029USD 1,060.0mUSD 107.1mUSD 96.5mUSD 73.1m0.17USD 48.6m
FY2030USD 1,180.0mUSD 121.5mUSD 109.7mUSD 82.6m0.19USD 56.0m
Revenue history and forecast03246499741,298FY23FY24FY25FY26FY27FY28FY29FY30Revenue
Revenue forecast with the research-cut boundary disclosed in the table.
Forecast margins0%3%6%8%11%FY26FY27FY28FY29FY30EBITDA marginNet margin
Margins are not held at a peak indefinitely; the model allows normalization as industry capacity expands.

EPS follows modeled net income and diluted shares without a manual override; the full series is shown in the table above.

12

Valuation

The target blends a forward earnings multiple with a lower-weight DCF cross-check.

MethodKey assumptionValue per shareWeight
Forward P/EFY2027 EPS 0.12 at 5.5xHKD 4.9690.0%
DCFWACC 12.0%; terminal growth 4.0%HKD 10.0110.0%
Blended targetRounded under house policyHKD 5.50100.0%

DCF sensitivity

WACC / g2.5%3.0%4.0%4.5%5.0%
10.0%HKD 11.30HKD 11.97HKD 13.66HKD 14.73HKD 16.02
11.0%HKD 9.85HKD 10.35HKD 11.57HKD 12.32HKD 13.19
12.0%HKD 8.71HKD 9.09HKD 10.01HKD 10.55HKD 11.18
13.0%HKD 7.78HKD 8.09HKD 8.79HKD 9.21HKD 9.68
14.0%HKD 7.03HKD 7.27HKD 7.83HKD 8.15HKD 8.51

Scenarios

ScenarioProbabilityEPS factorP/ETargetReturnCase
Bear25.0%0.72x4.0xHKD 2.60-23.0%K-Beauty demand moderates, customer acquisition becomes less efficient and inventory markdowns pressure margin.
Base55.0%1.00x5.5xHKD 5.0047.1%B2C and B2B growth continues while warehouse utilization and cost control lift margins gradually.
Bull20.0%1.18x7.0xHKD 7.40120.9%ABW distribution and non-core markets scale faster while fulfilment efficiency protects unit economics.

DCF terminal value and the chosen P/E multiple are assumptions, not observed facts. The rating remains pending analyst approval.

13

Scenarios, Catalysts and Risks

Customer acquisition and platform dependence

Medium probability / High impact. Higher paid-media or influencer cost can dilute contribution margin even while orders grow.

Valuation impact: A 150 bp FY2027 net-margin shortfall reduces EPS by about USD 0.028 and lowers the P/E indication by roughly HKD 1.2 per share at 5.5x.

Mitigation: Repeat customers, multilingual localization, direct mobile usage and diversified influencer relationships reduce but do not remove this exposure.

Inventory, markdown and working-capital risk

Medium probability / High impact. Rapid assortment growth can leave slow-moving inventory or require discounting, while B2B growth increases receivables.

Valuation impact: A slower inventory turn and 100 bp gross-margin loss weaken both cash conversion and equity value.

Mitigation: Broad demand data and multi-channel sell-through help, but complete brand purchase terms are private.

Trade, freight and foreign exchange

Medium probability / Medium-High impact. Tariffs, customs rules, carrier disruption and currency moves can change landed cost, delivery time and reported margin across more than 50 markets.

Valuation impact: A 200 bp margin shock lowers FY2027 EPS by about USD 0.037 per share before any volume response.

Mitigation: Regional warehouses and diversified markets shorten routes, but the group does not currently operate a formal FX hedging policy.

Execution after rapid capacity expansion

Medium probability / Medium impact. New AMR and South Korea capacity may not deliver expected labor savings or utilization if growth slows.

Valuation impact: Lower utilization raises fulfilment cost and reduces the DCF benefit of the recent capex cycle.

Mitigation: The first AMR deployment provides operating evidence, and management reports fulfilment accuracy above 99.99%.

Catalyst register

CatalystTimingEvidence to watchFinancial link
H1 2026 interim results28 August 2026Audited/reviewed revenue, net profit, segment and working-capital detail versus the July profit alertRevenue, margin and EPS
ABW retail rolloutQuarterly and annual updatesNew retail chains, market count, order value and receivablesB2B revenue, gross margin and cash conversion
Warehouse utilizationMedium termShipment volume, fulfilment accuracy, freight ratio and labor costOperating margin and FCFF
Non-core market mixAnnual reportingRegional revenue growth and language/localization expansionRevenue growth, freight and FX mix

Recent monitored events

DateEventDirectionImpact scoreForecast actionSource
2026-07-29Ulta Beauty Could Turn Target Partnership Exit into a Revenue Growth Opportunity, Analyst Sayspositive0.17monitorBenzinga
2026-07-24INSIDE INFORMATION POSITIVE PROFIT ALERT AND NOTICE OF BOARD MEETINGpositive0.83baseline_revision_candidateINSIDE INFORMATION POSITIVE PROFIT ALERT AND NOTICE OF BOARD MEETING
2026-06-28Bath & Body Works: Ulta Beauty Partnership Adds To An Already Compelling Value Storypositive0.15monitorSeeking Alpha
2026-06-26VOLUNTARY ANNOUNCEMENT BUSINESS UPDATE AND ORGANISATIONAL STREAMLININGuncertain0.59monitorVOLUNTARY ANNOUNCEMENT BUSINESS UPDATE AND ORGANISATIONAL STREAMLINING
2026-06-02Ulta Beauty Announces First Quarter Fiscal 2026 Results and Updates Fiscal 2026 Guidanceuncertain0.13monitorBusiness Wire
2026-06-02Ulta shares pop as beauty retailer beats Wall Street expectations and hikes earnings outlookpositive0.15monitorCNBC
2026-05-27Ulta Beauty, DC Studios and Warner Bros. Pictures Launch Exclusive Supergirl Partnership, Bridging Beauty & Cultureuncertain0.13monitorBusiness Wire
2026-05-12YipitData and Ulta Beauty Partner to Redefine Data-Driven Merchandisingnegative0.18monitorBusiness Wire
2026-05-11Sally Beauty Holdings Reports Second Quarter Fiscal 2026 Resultsnegative0.13monitorBusiness Wire
2026-04-24VOLUNTARY ANNOUNCEMENT BUSINESS UPDATE FOR THE FIRST QUARTER OF 2026positive0.60scenario_candidateVOLUNTARY ANNOUNCEMENT BUSINESS UPDATE FOR THE FIRST QUARTER OF 2026

Event paths are bounded monitoring scenarios. None of the listed market reactions is presented as proven causality.

14

Capital Allocation and Governance

Capital allocation

The model gives priority to balance-sheet capacity, reinvestment needs and cash conversion. Net cash is added in DCF, but only once; it is not also capitalized through the earnings multiple.

Expansion capex is explicitly deducted from FCFF in the year it is expected to be spent. A project can be strategically attractive and still reduce near-term free cash flow.

Governance stance

Reported actuals, research-cut dates, evidence hashes and approved ratings are outside the chatbot edit surface. Narrative and assumptions may change only through a validated, versioned patch.

Private contracts, complete customer rosters and undisclosed order economics remain unknown rather than estimated as facts.

Comparable-company screen

CompanyWhy includedHow used
Sa Sa InternationalHong Kong-listed beauty retailerBeauty demand and regional retail context; store economics differ
Stylevana / Glorious BrandsCross-border Asian beauty e-commerce competitorChannel and assortment context; private-company valuation is unavailable
JolseK-Beauty cross-border e-commerce competitorDigital assortment and international fulfilment context
THG BeautyGlobal online beauty platformCustomer-acquisition and fulfilment context; scale and geographic mix differ
15

Methodology, Sources and Disclosures

Evidence classes

Reported: official filing or exchange disclosure. Derived: deterministic calculation from reported figures. Forecast: model output using disclosed assumptions. Judgment: analyst interpretation. Scenario: bounded alternative, not a prediction.

Source ledger

SourceDateUseStatus
YesAsia Holdings Annual Report 20252026-04-23Audited financials, channels, customers, geography, warehouses and risksavailable
YesAsia FY2025 annual results announcement2026-03-27FY2025 reported financial resultsavailable
YesAsia first-quarter 2026 business update2026-04-24Q1 order value and B2C/B2B growthavailable
YesAsia H1 2026 positive profit alert2026-07-24Preliminary unaudited H1 revenue, profit and marginavailable
YesAsia organizational streamlining announcement2026-06-26Cost action and one-off termination expenseavailable
Argus verified YesAsia company-twin release2026-07-30Evidence-backed relationships, drivers and eventsavailable
Argus point-in-time statistical forecast run2026-07-30Frozen semiannual forecast control and backtestsavailable
Brand purchase terms, customer contracts and product-level marginKnown data gapknown_gap

Forecast governance

The point-in-time statistical baseline is frozen before event scenarios. Annual estimates use an explicit revenue-to-margin-to-EPS bridge. Events do not change the control forecast automatically; they create reviewable low/high deltas and require promotion into a new immutable version.

Limitations

  • Backtest histories are short and do not support strong claims of future accuracy.
  • Public disclosures do not reveal every customer, supplier, contract term or product-level margin.
  • Provider and extracted data are supporting evidence; official documents take precedence.
  • Valuation is sensitive to terminal growth, discount rates, multiples and the timing of operational assumptions.