Samsung Electronics Co., Ltd.

Initiation of coverage

Samsung Electronics Co., Ltd.

AI memory has reset earnings; the valuation depends on how long scarcity lasts

005930.KRKorea ExchangeSemiconductors, mobile devices, displays and consumer electronics2026-08-04
Evidence-backed research POC. Model indication: BUY; target KRW 325,000. Rating pending analyst approval.

Contents

Research cut 2026-08-04T23:59:59+09:00. Report figures are model outputs unless explicitly labelled reported or preliminary.

01

Investment Summary

AI memory has reset earnings; the valuation depends on how long scarcity lasts

RatingBUY
Target priceKRW 325,000
Reference priceKRW 240,000
Implied return35.4%

Samsung's 2026 earnings step-up is being driven by memory pricing and a richer AI product mix rather than a uniform recovery across the group. HBM, server DRAM and enterprise SSDs now carry the near-term estimate, while mobile, displays, appliances and Harman provide scale but much less incremental profit. Our case assumes the memory upcycle remains strong through 2027 and then normalizes; it does not capitalize current scarcity margins as a permanent condition.

What matters

Memory now explains the earnings step-up

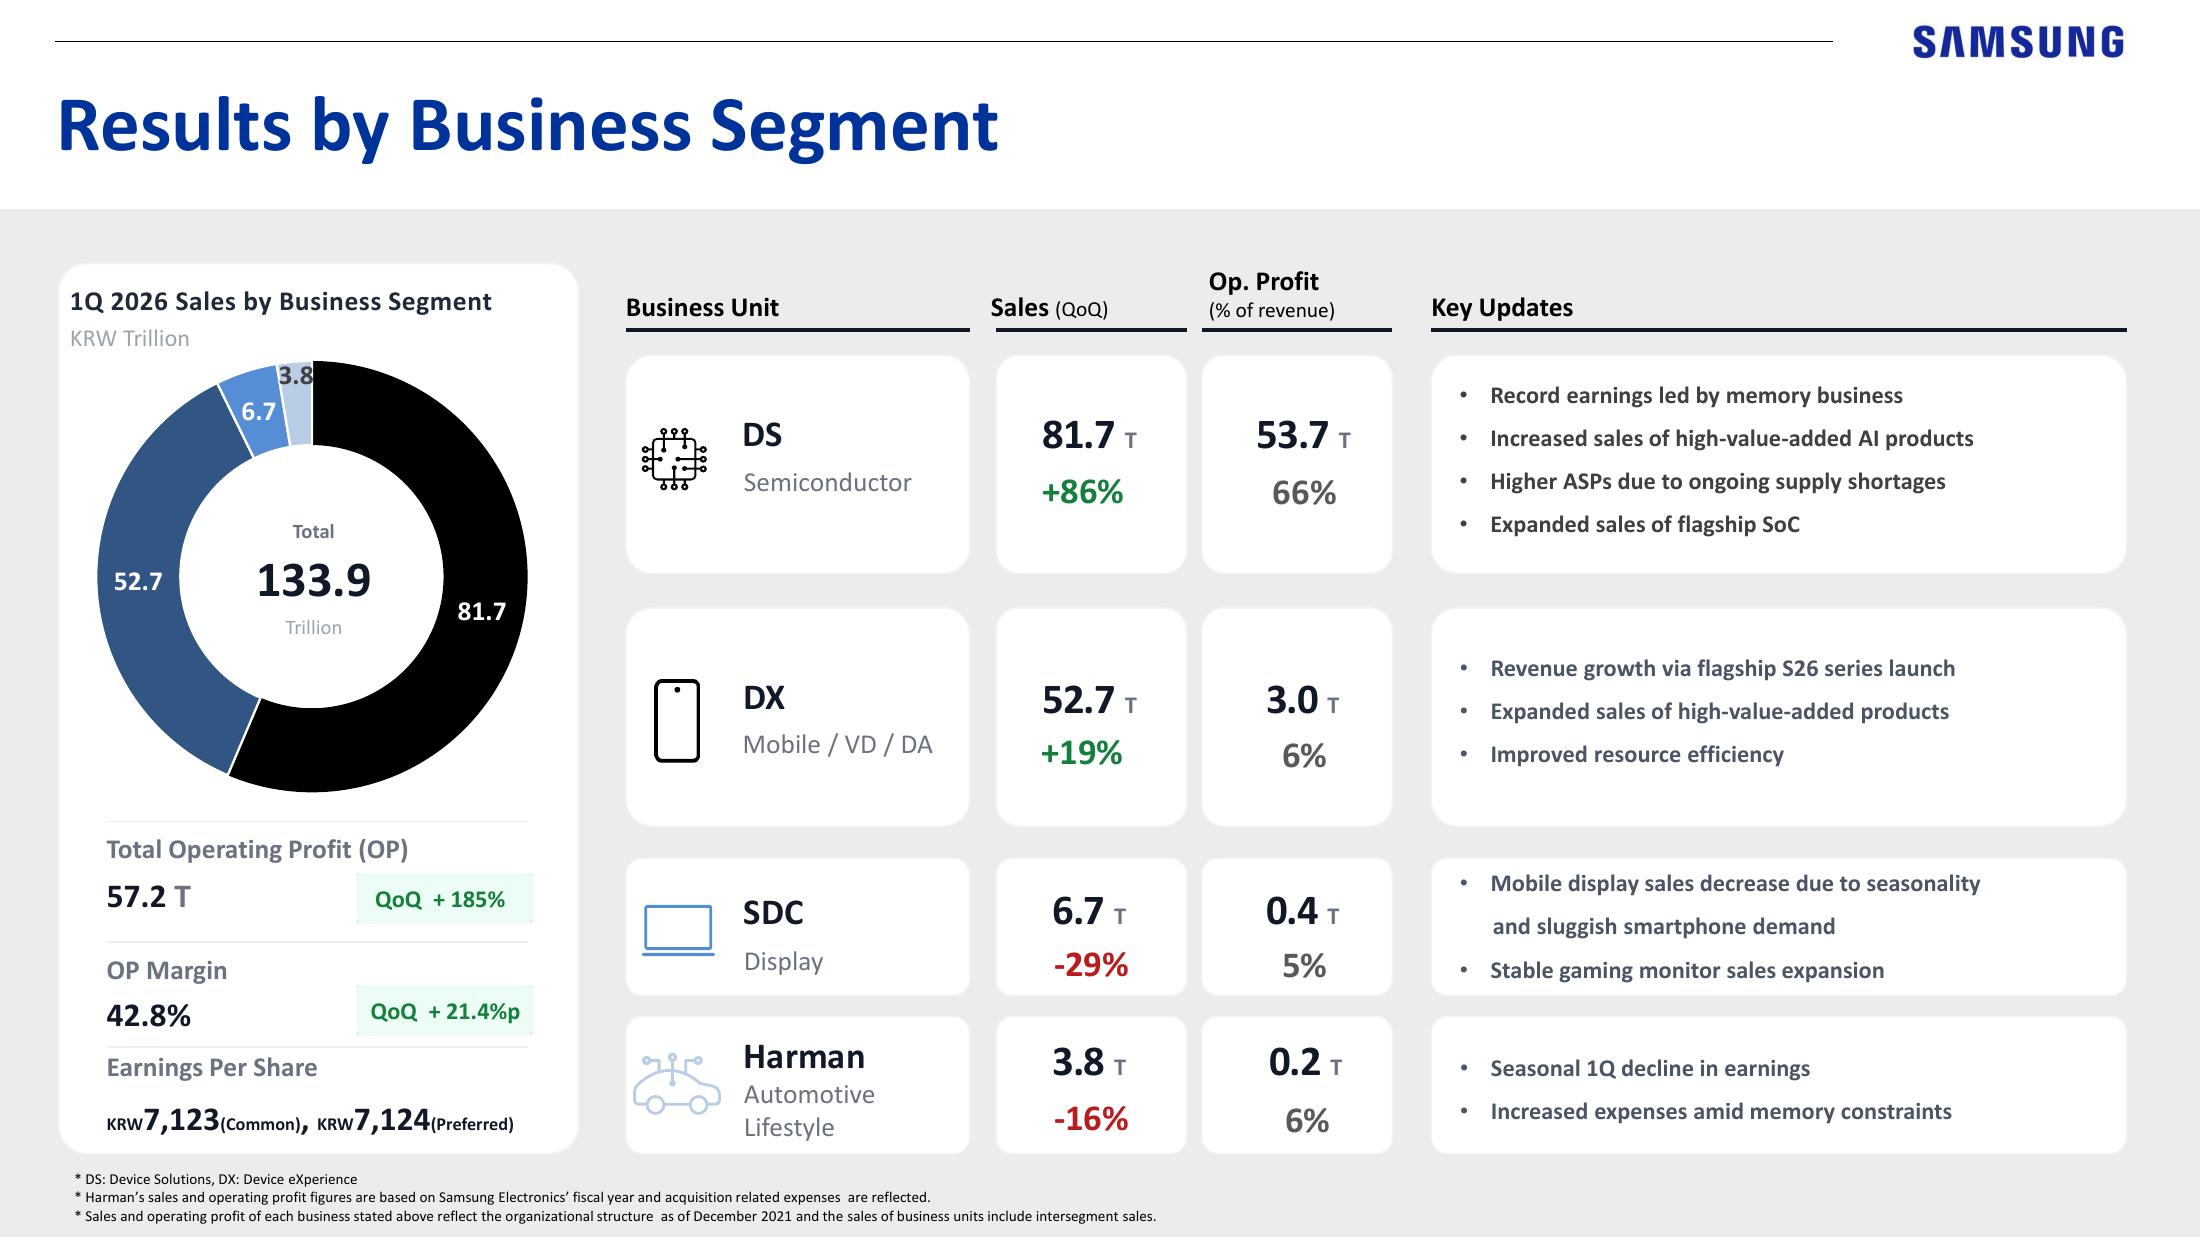
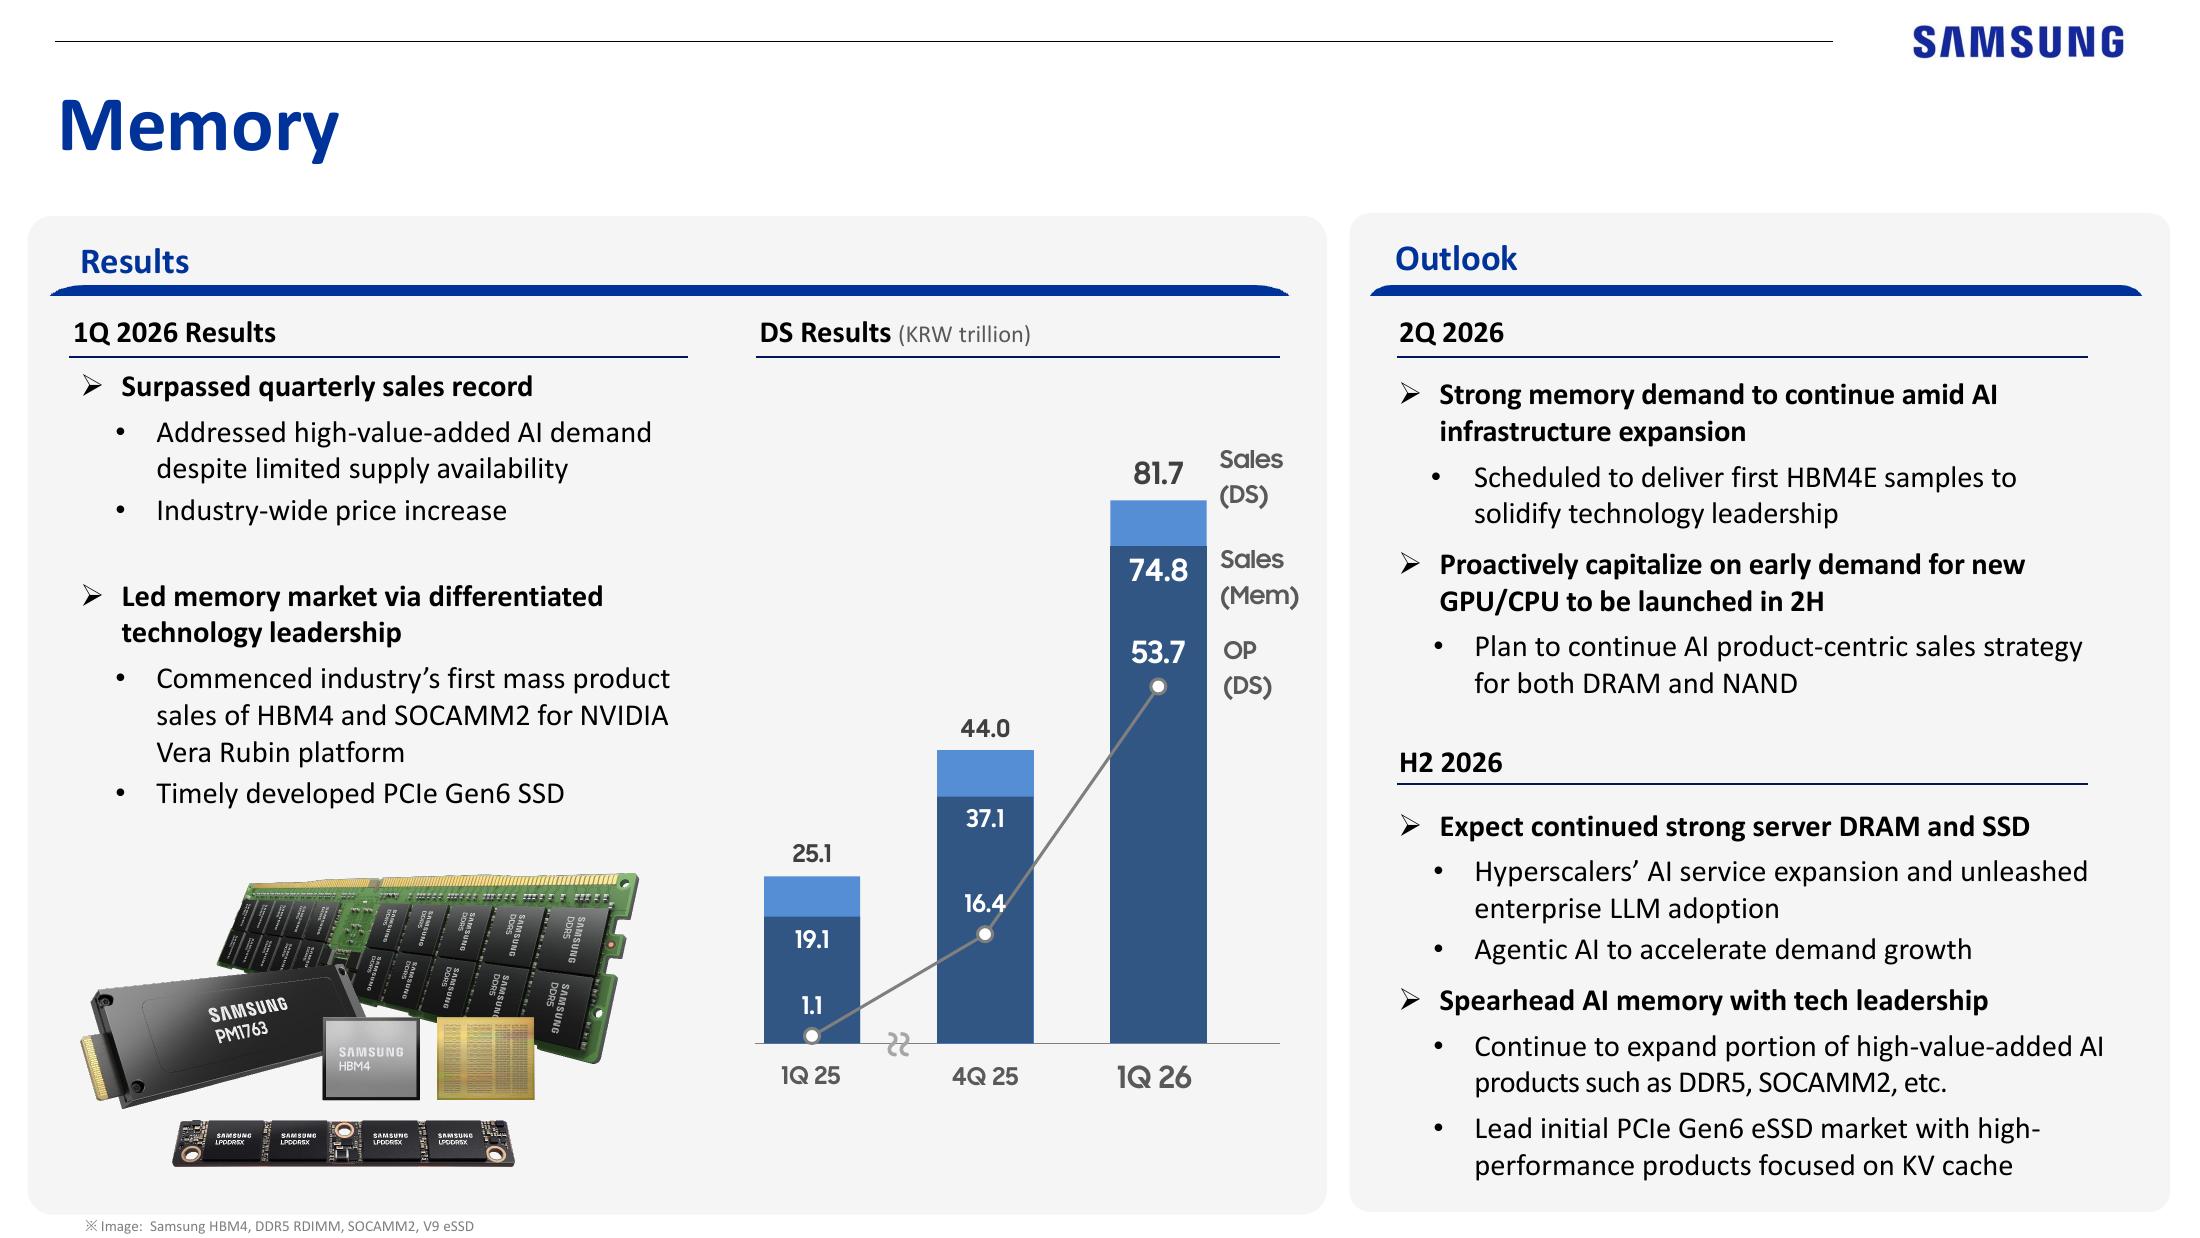
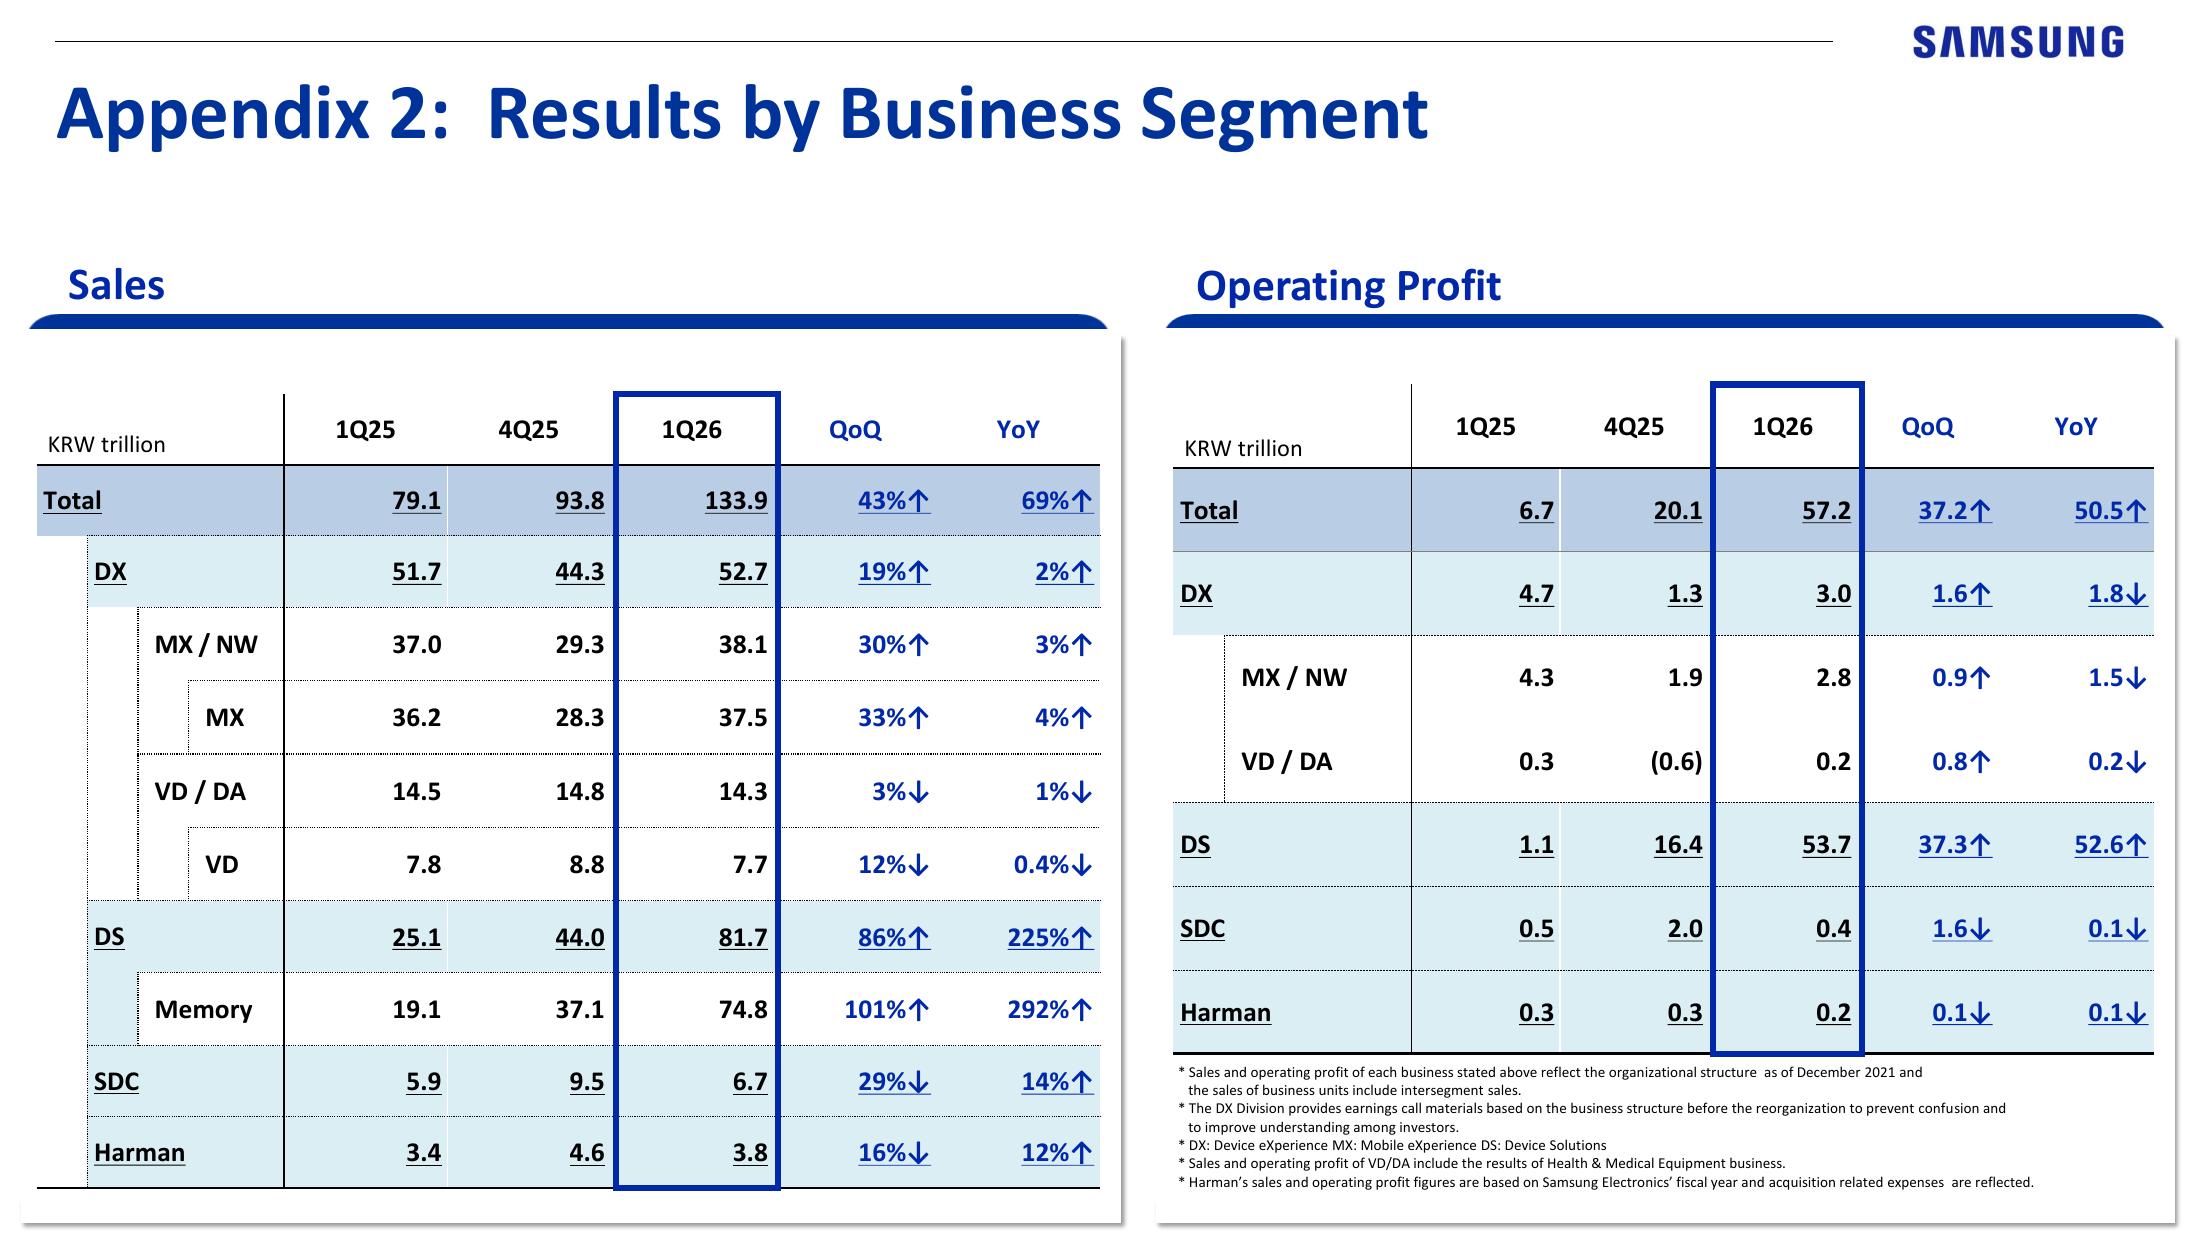
Device Solutions generated KRW81.7tn of Q1 2026 Revenue and KRW53.7tn of operating profit. The result was driven by high-value AI products, higher memory prices and constrained supply; it should not be read as a broad 43% group margin across every business.

Samsung Electronics Q1 2026 earnings presentation

HBM execution is both the catalyst and the concentration risk

Samsung began mass-product sales of HBM4 and SOCAMM2 for NVIDIA's Vera Rubin platform and planned HBM4E samples in Q2. Qualification, yield, packaging capacity and customer mix now have an unusually direct path into group earnings.

Samsung Electronics Q1 2026 earnings presentation

The rest of the group provides resilience, not the current profit surge

DX generated KRW52.7tn of Q1 Revenue but only KRW3.0tn of operating profit. Displays and Harman contributed another KRW10.5tn of segment Revenue and KRW0.6tn of operating profit. These businesses broaden cash flow but do not replace the semiconductor thesis.

Samsung Electronics Q1 2026 earnings presentation

Our outer-year margins deliberately fall

The model allows peak AI-memory economics through 2027, then reduces EBITDA and net margins as industry supply, customer bargaining and capital intensity catch up. A flat peak-margin extrapolation would produce a higher target but a weaker research case.

Derived model output

Share-price history099,138198,275297,413396,5502024-082024-102024-122025-022025-042025-062025-082025-092025-122026-012026-042026-062026-072026-08Share price
Reference-price history. The valuation date is fixed; subsequent prices are not included.
PeriodRevenueGrowthEBITDA marginEPS
FY2026KRW 700,000,000.0m109.8%50.0%41,543.03
FY2027KRW 820,000,000.0m17.1%50.0%52,731.93
FY2028KRW 900,000,000.0m9.8%48.0%55,045.87

The rating is a model indication pending analyst approval. It is not personalized investment advice.

02

Thesis and Variant View

The variant view is about conversion, not the existence of demand.

Memory now explains the earnings step-up

Device Solutions generated KRW81.7tn of Q1 2026 Revenue and KRW53.7tn of operating profit. The result was driven by high-value AI products, higher memory prices and constrained supply; it should not be read as a broad 43% group margin across every business.

HBM execution is both the catalyst and the concentration risk

Samsung began mass-product sales of HBM4 and SOCAMM2 for NVIDIA's Vera Rubin platform and planned HBM4E samples in Q2. Qualification, yield, packaging capacity and customer mix now have an unusually direct path into group earnings.

The rest of the group provides resilience, not the current profit surge

DX generated KRW52.7tn of Q1 Revenue but only KRW3.0tn of operating profit. Displays and Harman contributed another KRW10.5tn of segment Revenue and KRW0.6tn of operating profit. These businesses broaden cash flow but do not replace the semiconductor thesis.

Our outer-year margins deliberately fall

The model allows peak AI-memory economics through 2027, then reduces EBITDA and net margins as industry supply, customer bargaining and capital intensity catch up. A flat peak-margin extrapolation would produce a higher target but a weaker research case.

03

Business Model

Samsung Electronics operates two broad divisions. Device Solutions houses memory, System LSI and Foundry. Device eXperience includes mobile devices, networks, visual display and digital appliances. Samsung Display and Harman add OLED, automotive and connected-audio exposure. The group combines leading manufacturing scale, large research spending and a net-cash balance sheet with substantial semiconductor-cycle and capital-intensity risk.

Business lineWhat it doesPrimary earnings driver
MemoryDRAM, NAND, HBM and enterprise storage products serving AI, server, mobile and other computing demand.ASP, bit growth, product mix, yield, packaging capacity and customer qualification
System LSI and FoundryApplication processors, image sensors and contract semiconductor manufacturing across advanced and mature nodes.Design wins, advanced-node utilization, yield, wafer pricing and capex
Mobile eXperience and NetworksGalaxy smartphones, tablets, wearables and telecom-network equipment.Shipments, premium mix, component cost, channel inventory and marketing
Display, Visual Display and AppliancesOLED panels, televisions, monitors and home appliances, including premium and AI-enabled product lines.Panel utilization, premium mix, replacement demand, tariffs and input cost
HarmanAutomotive electronics, connected systems and premium consumer audio.Automotive production, design-win conversion, order backlog and component availability
Q1 2026 Revenue and operating profit by business segment
Q1 2026 Revenue and operating profit by business segment. Source: Samsung Electronics Q1 2026 earnings presentation, p. 6.
04

Company Operating Map

A compact view of how products, capacity, counterparties and risks connect to the financial model.

Revised in v5
Reviewed company system mapSamsungElectronics26 entities / 44 relationshipsBusiness structure7Device Solutions DivisionDevice eXperience DivisionDigital Appliances BusinessCustomers and ecosystem2Advanced Micro Devices, Inc.Broadcom Inc.Policy1Advanced semiconductor export controlsProducts and technology10Advanced semiconductor packagingDRAMEnterprise SSDOperations and facilities2Pyeongtaek semiconductor campusTaylor semiconductor siteBusiness drivers1AI infrastructure semiconductor demand
Highest-relevance reviewed entities grouped by operating role. Counts cover the full published graph; the complete relationship-level network remains available in the interactive company twin.
Driver to financial metric mapBusiness driversFinancial compartmentsForecast metricsMemory ASP and mixHBM executionAI infrastructure demandSemiconductor capexMobile mix and costsFoundry utilizationDevice Solutions RevenueGross marginMemory volumeProduct mixHBM and server demandCapacityDepreciationRevenueEPSFCFF
Driver paths describe a financial mechanism, not proven causality. Only reviewed driver-to-financial mappings enter the forecast; a graph connection alone never creates an earnings adjustment.
05

Industry and Demand

AI infrastructure is changing the memory mix more quickly than total semiconductor unit demand. HBM, high-capacity server DRAM and enterprise SSDs command different pricing, yield and qualification economics from commodity memory.

A memory shortage can create exceptional operating leverage because fabrication and development costs are high while incremental pricing flows rapidly into gross profit. The same mechanism reverses when capacity and inventory outrun demand.

HBM competition is not decided by nominal capacity alone. Yield, thermal performance, advanced packaging, customer qualification and on-time delivery determine whether announced output converts into premium Revenue.

Samsung's device businesses remain strategically important because they provide scale, internal component demand and ecosystem control. Their lower margins also mean a smartphone or appliance recovery has less valuation impact than an equivalent percentage change in Memory.

Reviewed driver importance0%28%56%84%112%98.0%Memory ASP and mix94.0%HBM execution91.0%AI infrastructure 78.0%Semiconductor cape63.0%Mobile mix and cos60.0%Foundry utilizatio
Monitoring priorities derived from filings, operating disclosures and the reviewed company graph.
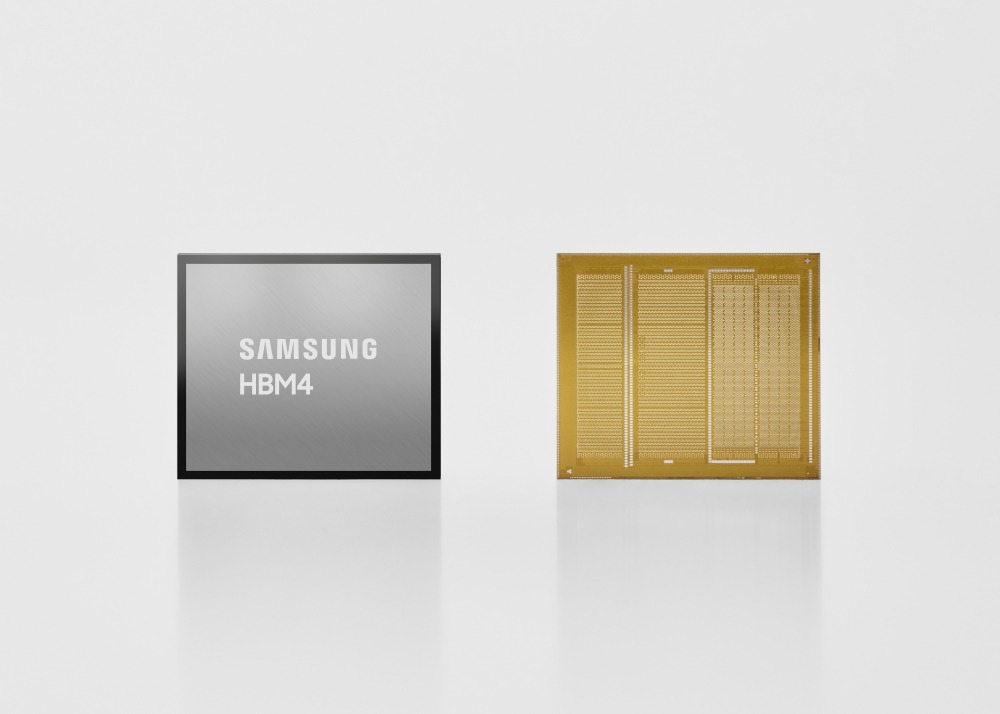
Samsung's HBM4 pairs advanced DRAM with a logic base die for AI-computing workloads
Samsung's HBM4 pairs advanced DRAM with a logic base die for AI-computing workloads. Source: Samsung begins commercial HBM4 shipments.
06

Products and Technology

Product or marketRoleWhy it matters
Advanced semiconductor packagingAdvanced chip integration capabilityPackaging expands the value captured per AI chip program and can differentiate Samsung's foundry offering, but depends on yield and customer qualification.
DRAMCore volatile-memory portfolioIndustry supply discipline, bit demand, pricing, process migration and product mix make DRAM one of the largest swing factors in semiconductor revenue and operating profit.
Enterprise SSDDatacenter storage portfolioHyperscaler capital spending, NAND pricing, qualification cycles, storage density and controller performance determine enterprise SSD volume, mix and margins.
Exynos processors and image sensorsSystem LSI processor and imaging portfolioExternal design wins and adoption in Samsung devices affect logic revenue, utilization and the economics of advanced-node development.
Foundry servicesContract semiconductor manufacturingCustomer wins, advanced-node yield, wafer utilization and capital intensity determine whether foundry scale contributes earnings or absorbs substantial depreciation and development cost.
Galaxy smartphones and devicesFlagship consumer-device franchiseLaunch timing, unit shipments, average selling prices, component costs and ecosystem retention directly affect the Device eXperience division's revenue and profit.
HBM4Fourth-generation high-bandwidth memoryQualification, yield, capacity ramp and customer supply agreements can materially shift Samsung's memory mix, pricing and semiconductor earnings.
High Bandwidth MemoryAI memory product familyHBM mix and qualification can influence memory pricing, utilization and profit per wafer, making it a central link between AI infrastructure spending and Samsung's semiconductor earnings.
Image sensorsMobile and automotive imaging portfolioDesign wins, pixel-performance leadership, handset demand and manufacturing yield affect logic-semiconductor revenue and external customer penetration.
Memory semiconductorsDRAM and NAND product portfolioIndustry supply growth, inventories, bit demand, product mix and contract prices drive revenue and create substantial operating leverage in the Device Solutions division.
Device eXperience DivisionConsumer devices and networks divisionSmartphone shipments and mix, component costs, product launches, channel inventory, television demand and appliance replacement cycles are its principal earnings drivers.
Device Solutions DivisionSemiconductor divisionDRAM and NAND pricing, HBM qualification, process yields, foundry utilization and capital expenditure can move Samsung's consolidated profit much more sharply than changes in semiconductor revenue alone.
Digital Appliances BusinessHome-appliance businessHousing and replacement demand, raw-material costs, logistics and premium-product mix drive appliance sales and margins.
Memory BusinessMemory semiconductor businessMemory pricing, bit shipments, product mix, yields and industry inventory cycles are major drivers of Device Solutions revenue and operating profit.
Mobile eXperience BusinessSmartphone and mobile-device businessPremium-device mix, unit shipments, component costs and ecosystem monetization directly influence Samsung's consumer-electronics revenue and margins.
System LSI BusinessLogic semiconductor design businessDesign wins, flagship-device demand and external customer adoption determine scale, while internal Galaxy usage can support volumes.
Visual Display BusinessTelevision and display-products businessPanel costs, premium-screen mix, global television demand, replacement cycles and competitive pricing shape revenue, inventory requirements and profitability.
Memory results and HBM/server demand outlook
Memory results and HBM/server demand outlook. Source: Samsung Electronics Q1 2026 earnings presentation, p. 7.
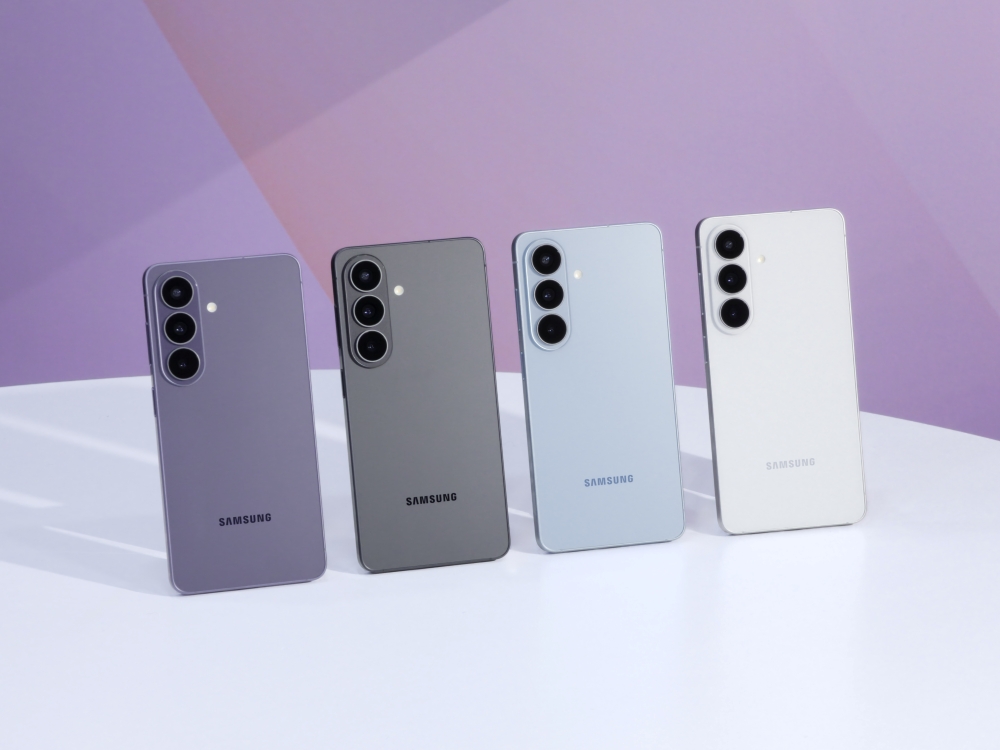
Galaxy S26 series represents Samsung's premium mobile and on-device AI platform
Galaxy S26 series represents Samsung's premium mobile and on-device AI platform. Source: Samsung unveils the Galaxy S26 series.
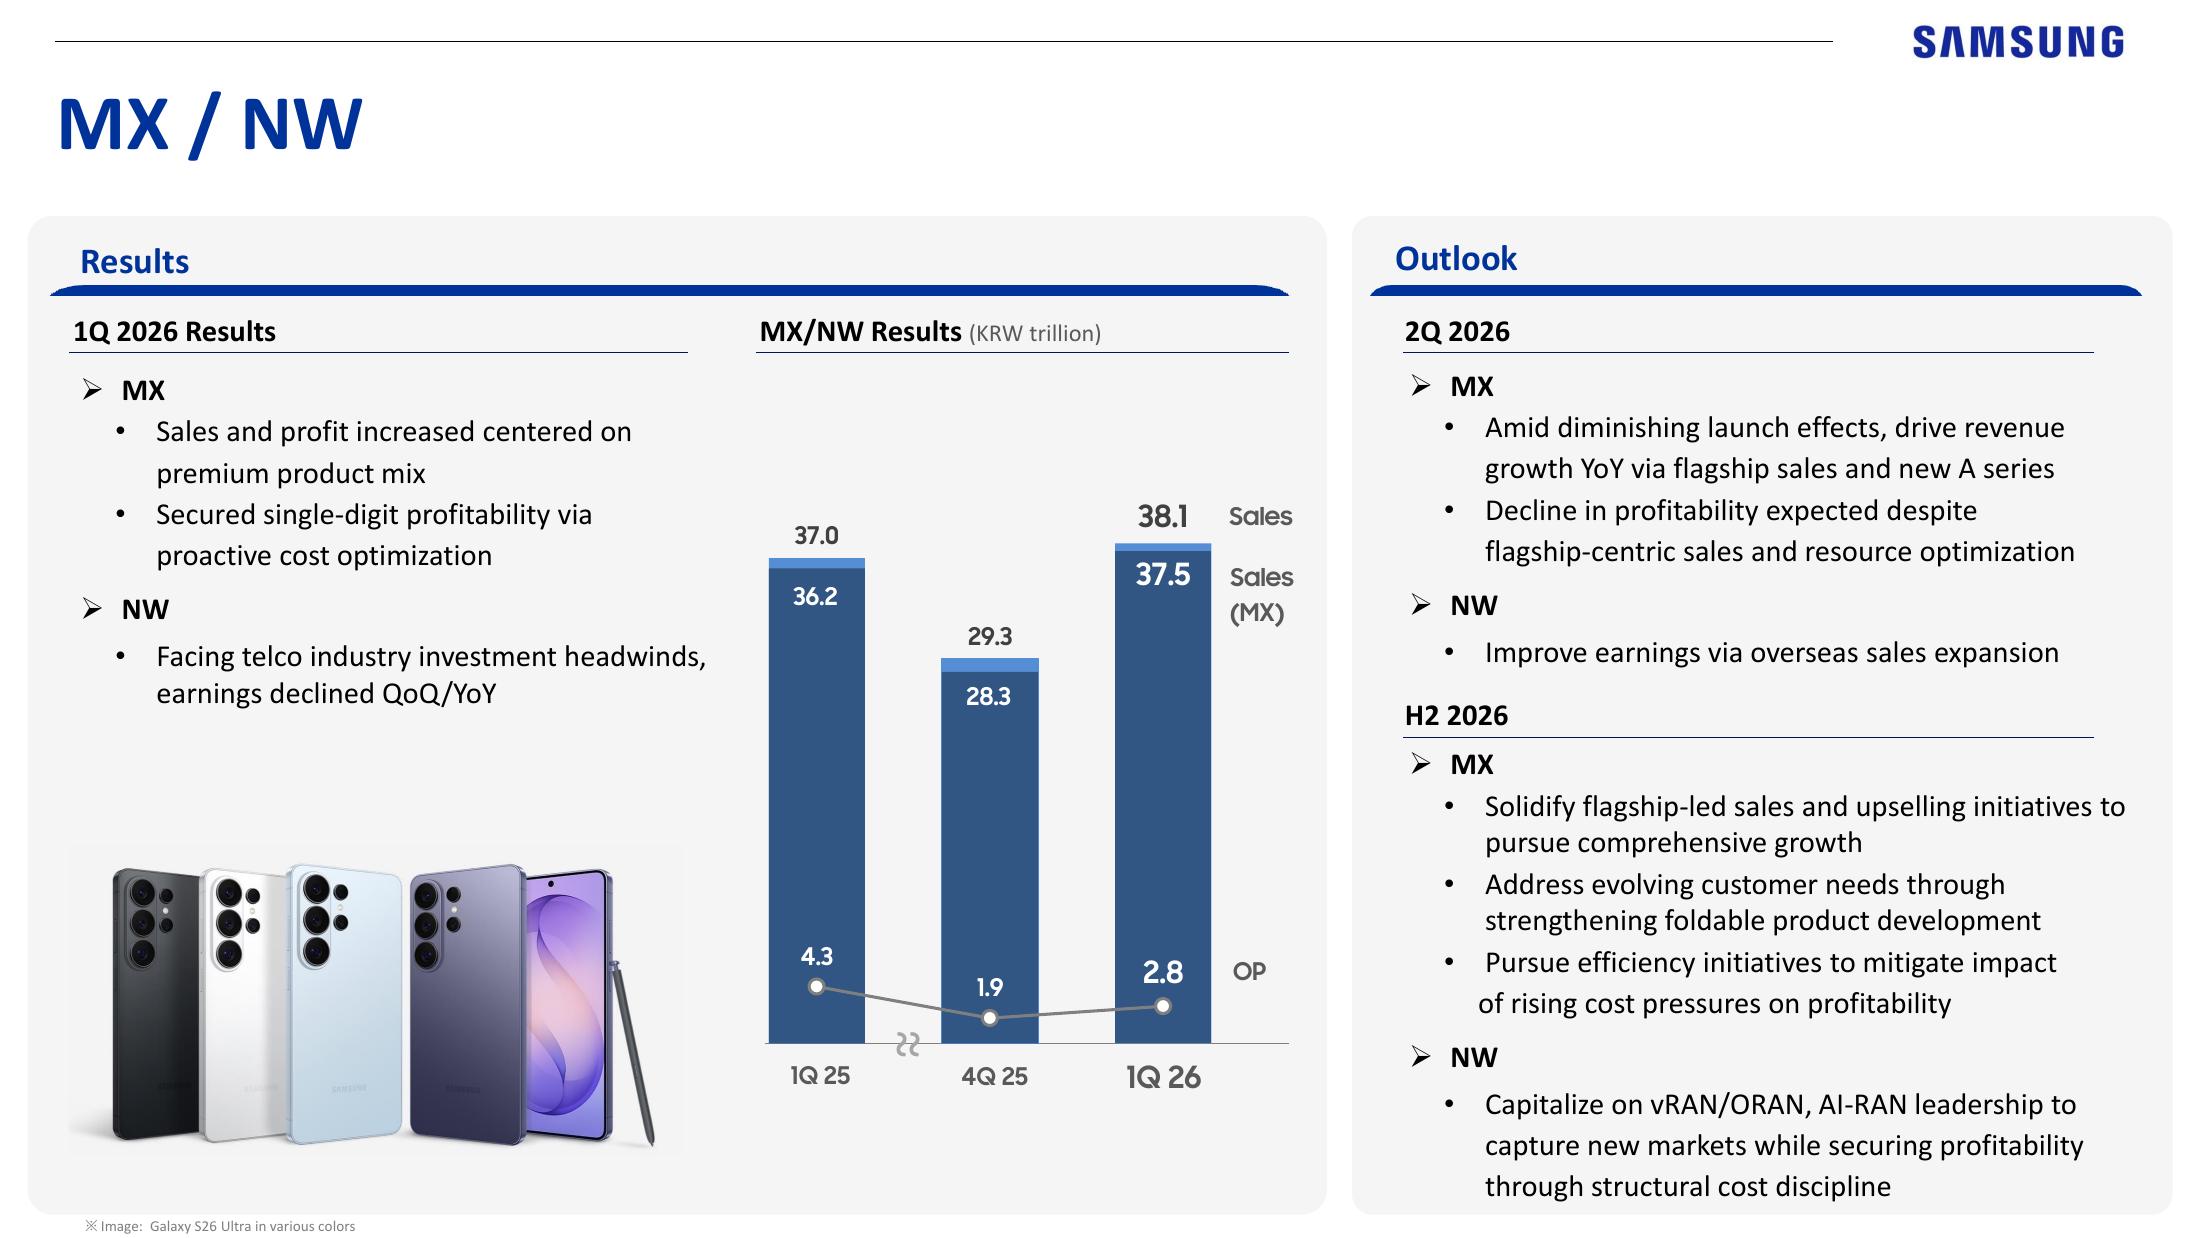
Mobile eXperience and Networks results and outlook
Mobile eXperience and Networks results and outlook. Source: Samsung Electronics Q1 2026 earnings presentation, p. 10.
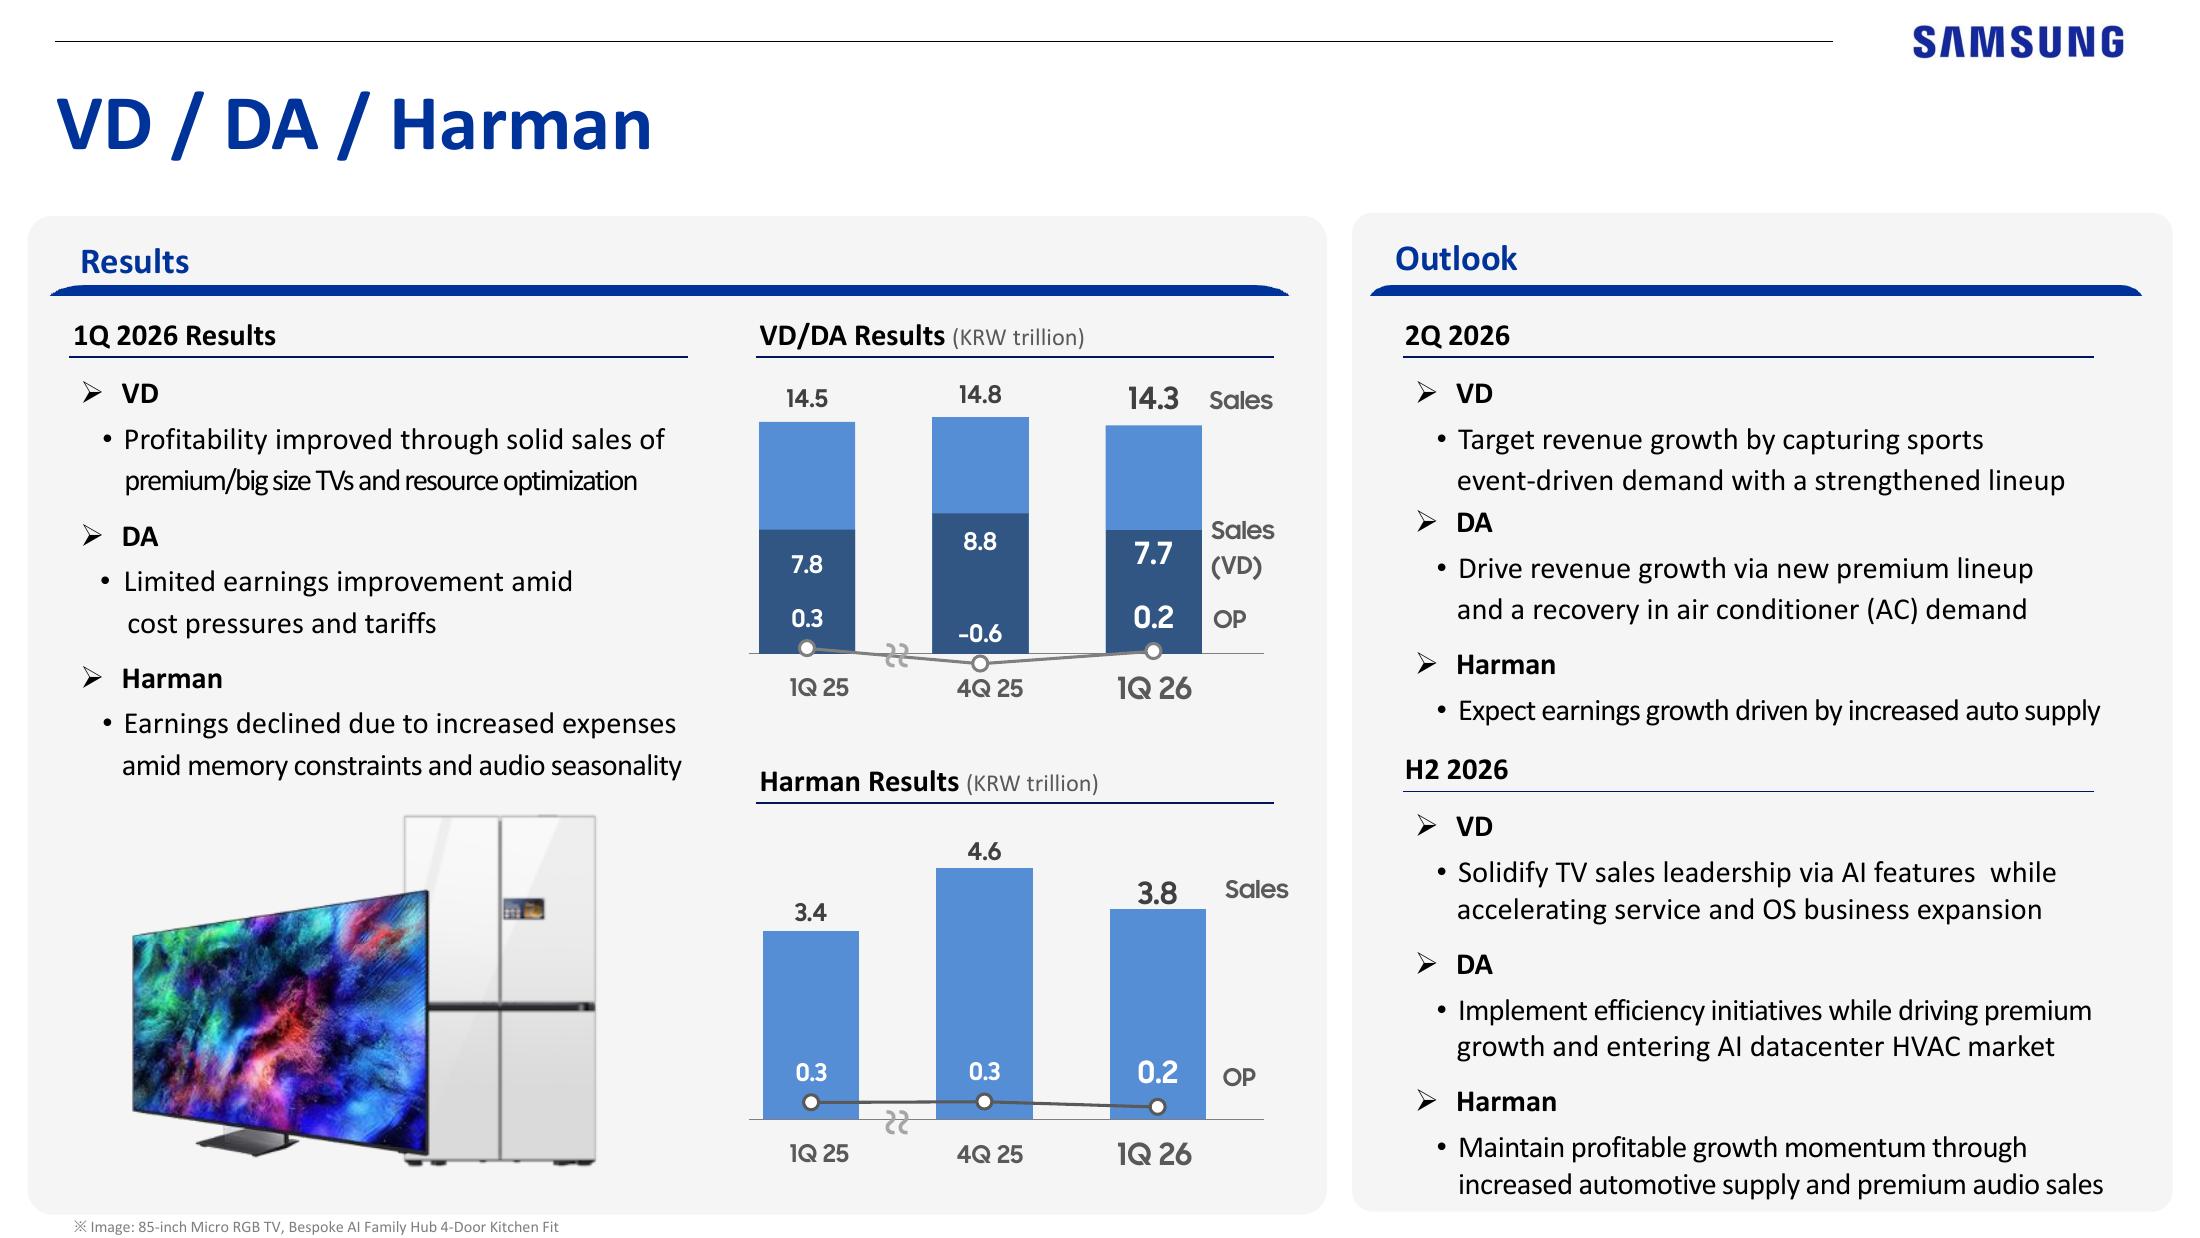
Visual Display, Digital Appliances and HARMAN outlook
Visual Display, Digital Appliances and HARMAN outlook. Source: Samsung Electronics Q1 2026 earnings presentation, p. 11.
07

Customers, Partners and End Markets

Public disclosures support customer types, channels and selected counterparties; they do not support a complete customer roster or private contract economics.

RelationshipRoleCompany relevance
Advanced Micro Devices, Inc.AI memory and computing partnerSuccessful qualification and shipment into AMD accelerator and CPU platforms can support high-value memory volumes and create foundry opportunities.
Broadcom Inc.AI memory and foundry collaboration partnerThe relationship can create multi-technology revenue across memory, foundry and packaging, subject to product execution and the non-binding nature of an MOU.
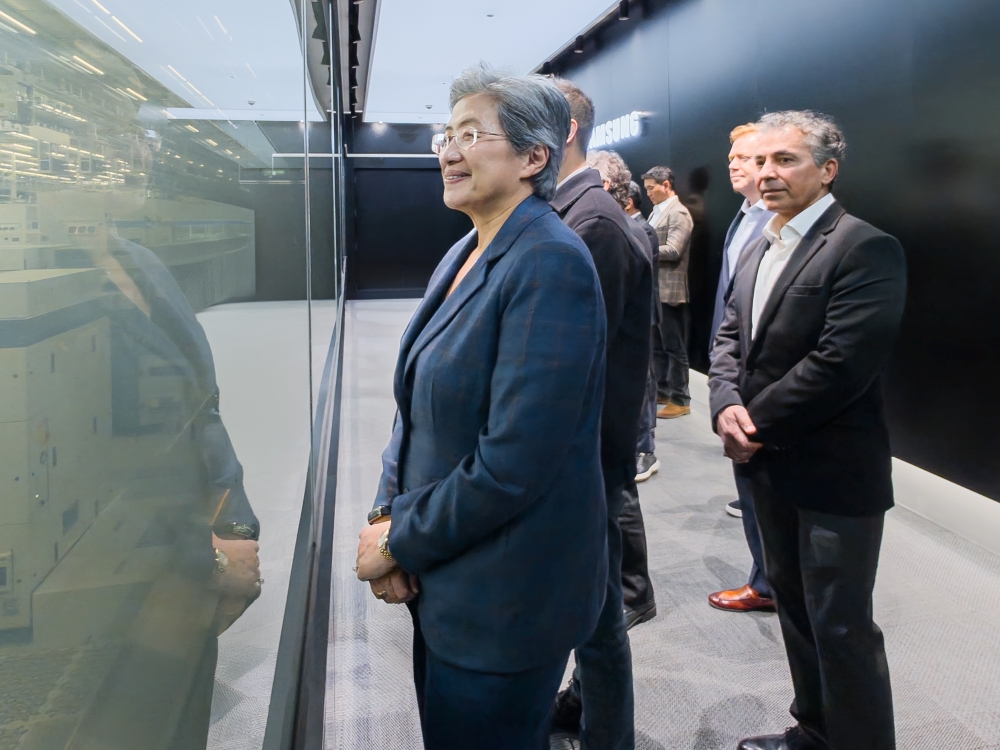
Samsung and AMD's AI-memory collaboration links HBM4 supply to accelerator demand
Samsung and AMD's AI-memory collaboration links HBM4 supply to accelerator demand. Source: Samsung and AMD expand AI-memory collaboration.
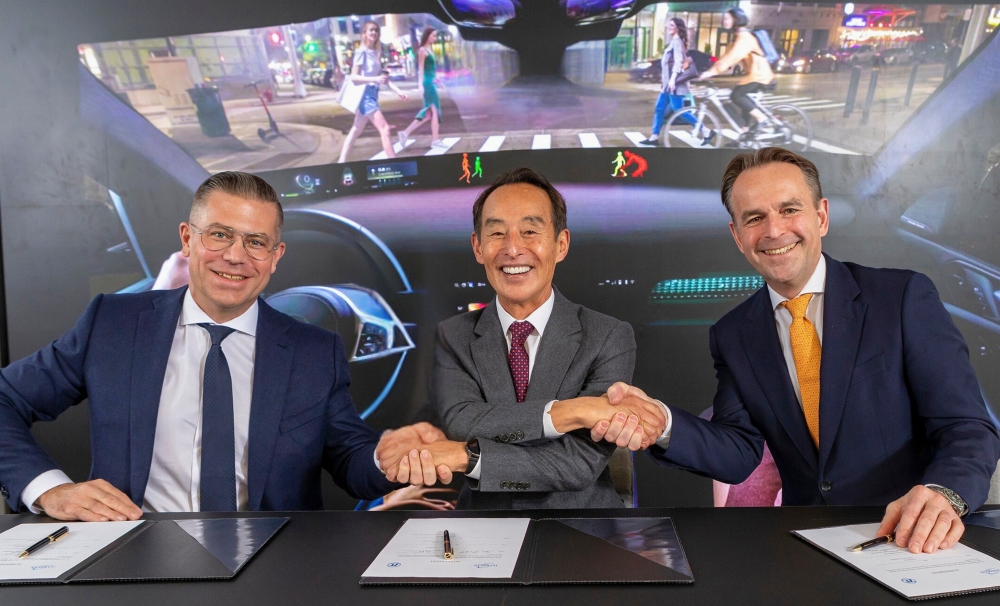
HARMAN's proposed ZF ADAS acquisition extends Samsung's automotive technology exposure
HARMAN's proposed ZF ADAS acquisition extends Samsung's automotive technology exposure. Source: HARMAN agreement to acquire ZF's ADAS business.
08

Manufacturing and Supply Chain

Asset, input or providerRoleOperational significance
Pyeongtaek semiconductor campusMajor Korean semiconductor production siteCapacity additions, equipment installation, yields, power and water availability, and utilization at this site influence semiconductor supply and the return on invested capital.
Taylor semiconductor siteUnited States semiconductor investmentConstruction timing, incentives, equipment readiness, customer commitments and process ramp execution determine when the site begins contributing revenue and absorbing depreciation.
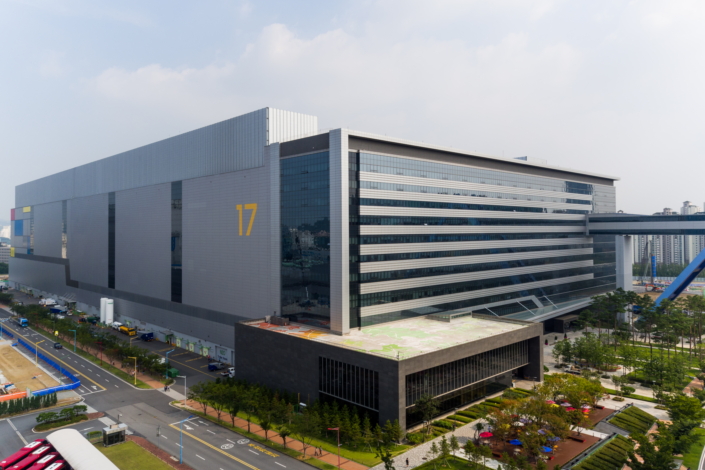
Line 17 at Samsung's Hwaseong semiconductor campus
Line 17 at Samsung's Hwaseong semiconductor campus. Source: Samsung semiconductor operations photo essay.
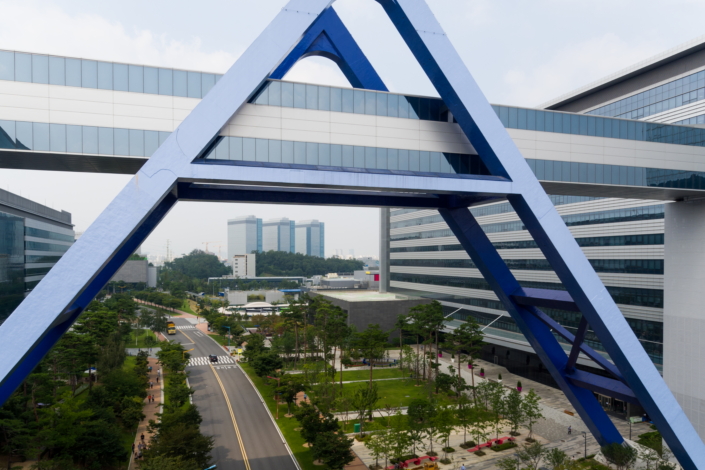
Bridged fabrication lines illustrate Samsung's clustered manufacturing footprint
Bridged fabrication lines illustrate Samsung's clustered manufacturing footprint. Source: Samsung semiconductor operations photo essay.
09

Historical Financials

PeriodRevenueEBITDANet incomeEPS
FY2023KRW 258,935,494.0mKRW 49,715,527.0mKRW 14,473,401.0m2,130.74
FY2024KRW 300,870,903.0mKRW 80,313,430.0mKRW 33,621,363.0m4,950.00
FY2025KRW 333,605,938.0mKRW 97,013,846.0mKRW 44,260,956.0m6,605.00
Revenue history and forecast0283,250,000566,500,000849,750,0001,133,000,000FY23FY24FY25FY26FY27FY28FY29FY30Revenue
Solid line combines reported history and analyst forecasts; the boundary is identified in the table and methodology.
EPS history and forecast015,49030,98046,47161,961FY23FY24FY25FY26FY27FY28FY29FY30EPS
Per-share history follows the stated share basis in the source records.
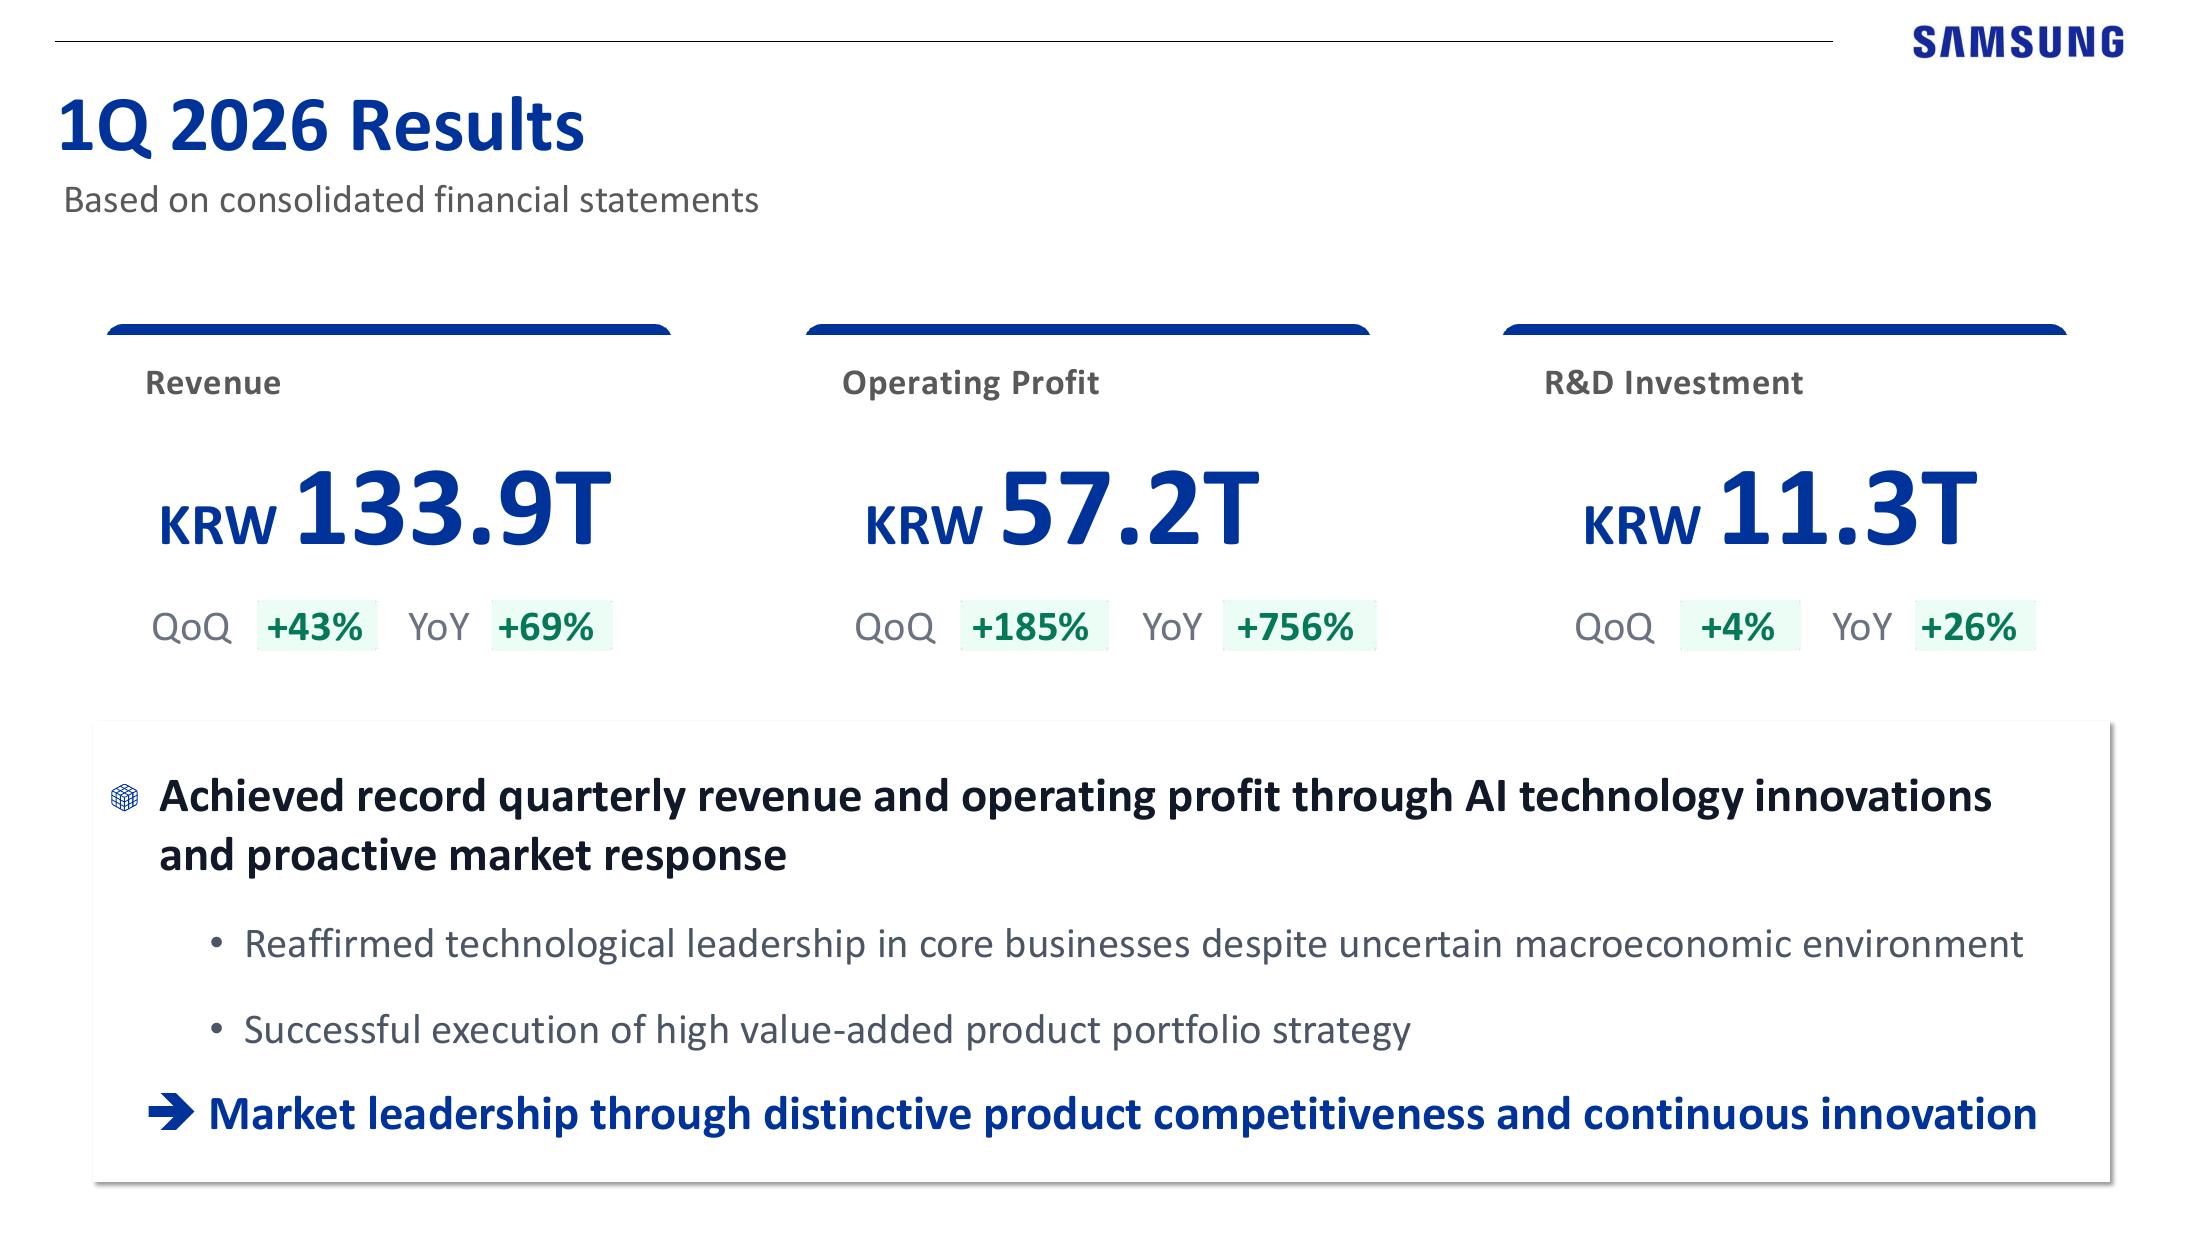
Q1 2026 Revenue, operating profit and R&D investment
Q1 2026 Revenue, operating profit and R&D investment. Source: Samsung Electronics Q1 2026 earnings presentation, p. 5.
Official segment Revenue and operating-profit appendix
Official segment Revenue and operating-profit appendix. Source: Samsung Electronics Q1 2026 earnings presentation, p. 13.
10

Forecast Framework

A statistical control and a separate analyst driver model are kept visible.

Revenue = demand x addressable exposure x order conversion x capacity realizationEBITDA = Revenue x EBITDA marginEPS = Net income / diluted sharesFCFF = EBIT x (1 - tax) + D&A - capex - change in working capital

Point-in-time control model

MetricSelected modelPeriodsWAPEBiasInterval coverage
GAAP diluted EPSdamped_median_delta1547.1%-23.3%60.0%
Net incomedamped_median_growth1540.8%-16.3%66.7%
Revenuerobust_ensemble1511.2%-6.9%66.7%

The control is selected through expanding-window backtesting. Small samples make these diagnostics descriptive rather than conclusive. The annual analyst case uses operating evidence and does not overwrite the frozen control.

Next reported period

PeriodRevenueGAAP EPSModelBasis
FY2026 Q3KRW 180,000,000.0m11,500.00Memory-cycle driver bridgeQ2 guidance, server-memory demand, HBM mix, normalized diluted shares and a lower peak-margin assumption than the statistical net-income control

Annual assumption bridge

YearRevenue growthEBITDA marginNet marginCapex / revenueBasis
FY2026109.8%50.0%40.0%12.0%Official Q1 results and Q2 guidance, followed by strong but not accelerating H2 memory pricing and AI-product mix
FY202717.1%50.0%42.7%13.0%HBM, server DRAM and enterprise SSD demand remain strong while 2nm and advanced packaging scale; repurchases lower shares
FY20289.8%48.0%40.0%13.0%Memory supply response begins to moderate price and margin, partly offset by AI mix and foundry utilization
FY20297.8%46.0%37.0%12.0%Mid-cycle normalization across memory, with mobile, display, automotive and services supporting group breadth
FY20306.2%44.0%35.0%11.5%Steady-state case with lower semiconductor scarcity rents and continued capital intensity
11

Financial Forecasts

YearRevenueEBITDAEBITNet incomeEPSFCFF
FY2026KRW 700,000,000.0mKRW 350,000,000.0mKRW 301,000,000.0mKRW 280,000,000.0m41,543.03KRW 188,300,000.0m
FY2027KRW 820,000,000.0mKRW 410,000,000.0mKRW 352,600,000.0mKRW 350,140,000.0m52,731.93KRW 216,480,000.0m
FY2028KRW 900,000,000.0mKRW 432,000,000.0mKRW 364,500,000.0mKRW 360,000,000.0m55,045.87KRW 228,600,000.0m
FY2029KRW 970,000,000.0mKRW 446,200,000.0mKRW 373,450,000.0mKRW 358,900,000.0m55,557.28KRW 243,470,000.0m
FY2030KRW 1,030,000,000.0mKRW 453,200,000.0mKRW 375,950,000.0mKRW 360,500,000.0m56,328.12KRW 249,260,000.0m
Revenue history and forecast0283,250,000566,500,000849,750,0001,133,000,000FY23FY24FY25FY26FY27FY28FY29FY30Revenue
Revenue forecast with the research-cut boundary disclosed in the table.
Forecast margins0%14%28%41%55%FY26FY27FY28FY29FY30EBITDA marginNet margin
Margins are not held at a peak indefinitely; the model allows normalization as industry capacity expands.

EPS follows modeled net income and diluted shares without a manual override; the full series is shown in the table above.

12

Valuation

The target blends a forward earnings multiple with a lower-weight DCF cross-check.

MethodKey assumptionValue per shareWeight
Forward P/EFY2027 EPS 52,731.93 at 6.0xKRW 316,39295.0%
DCFWACC 9.5%; terminal growth 2.5%KRW 488,6535.0%
Blended targetRounded under house policyKRW 325,000100.0%

DCF sensitivity

WACC / g1.5%2.0%2.5%3.0%3.5%
7.5%KRW 587,624KRW 629,600KRW 679,973KRW 741,538KRW 818,496
8.5%KRW 504,788KRW 534,126KRW 568,353KRW 608,803KRW 657,344
9.5%KRW 442,697KRW 464,143KRW 488,653KRW 516,934KRW 549,928
10.5%KRW 394,435KRW 410,655KRW 428,903KRW 449,583KRW 473,217
11.5%KRW 355,853KRW 368,452KRW 382,451KRW 398,096KRW 415,698

Scenarios

ScenarioProbabilityEPS factorP/ETargetReturnCase
Bear25.0%0.68x5.0xKRW 179,000-25.3%Memory supply responds faster, HBM qualification or mix disappoints and mobile input costs remain elevated.
Base55.0%1.00x6.0xKRW 316,00031.8%AI memory demand supports 2026-27 earnings before margins normalize as industry supply expands.
Bull20.0%1.20x7.5xKRW 475,00097.7%HBM leadership, advanced packaging and foundry utilization improve together while the memory shortage persists longer.
Scenario valuation range0135,375270,750406,125541,500179,000.0Bear316,000.0Base475,000.0Bull
Scenario target prices are deterministic outputs of the disclosed EPS factors and valuation multiples.

DCF terminal value and the chosen P/E multiple are assumptions, not observed facts. The rating remains pending analyst approval.

13

Scenarios, Catalysts and Risks

Risk probability and impact matrixProbabilityImpactLowLowMediumMediumHighHigh1Memory pricing normalizes so...2HBM qualification, yield or ...3Foundry underutilization and...4Export controls and geopolit...
Risk positions reflect the probability and impact labels in the reviewed risk register; they are not statistical event probabilities.

Memory pricing normalizes sooner than expected

Medium probability / Very High impact. New industry supply, customer inventory or slower AI capex can reduce ASP and utilization while depreciation remains fixed.

Valuation impact: A 500 bp FY2027 net-margin shortfall lowers EPS by roughly KRW6,175 and the 6x P/E indication by about KRW37,000 per share.

Mitigation: A richer HBM/server mix, product leadership and net cash provide resilience, but do not remove cycle risk.

HBM qualification, yield or packaging execution

Medium probability / High impact. Delayed customer qualification or poor yield can shift premium demand to competitors and strand expensive capacity.

Valuation impact: A 10% reduction in modeled FY2027 net income lowers EPS and the P/E indication by roughly the same proportion before any multiple change.

Mitigation: Samsung reported HBM4 mass-product sales and continues advanced packaging and process investment; customer concentration remains relevant.

Foundry underutilization and capex burden

Medium probability / High impact. Advanced-node investment requires high utilization and yield; delays or weak external demand reduce returns and free cash flow.

Valuation impact: A 200 bp increase in capex to Revenue reduces FY2027 FCFF by KRW16.4tn and weakens the DCF cross-check.

Mitigation: HPC design wins, 2nm development and internal semiconductor demand support the roadmap, but economic returns remain execution-dependent.

Export controls and geopolitical concentration

Medium probability / High impact. Technology restrictions, customer rules and regional incentives can change accessible markets, equipment supply and manufacturing economics.

Valuation impact: The effect can reach Revenue, capex, working capital and the valuation multiple simultaneously; a single deterministic percentage is not defensible without a specified rule and exposure.

Mitigation: Korean and US manufacturing footprints diversify capacity, while advanced semiconductor tools and end demand remain globally interdependent.

Catalyst register

CatalystTimingEvidence to watchFinancial link
Third-quarter 2026 resultsOctober 2026Memory Revenue, DS operating margin, HBM mix, inventory and capexRevenue, margin, EPS and FCFF
HBM4E samples and customer qualificationSecond half 2026Customer approval, shipment timing, yield and packaging capacityMemory ASP, mix and utilization
2nm and advanced-node ramp2026-2027Utilization, design wins, yield and external foundry RevenueFoundry Revenue, margin and capex returns
Share cancellation and repurchasesBoard disclosuresShares acquired or cancelled and remaining authorizationDiluted shares and per-share value

No separate event-intelligence layer was frozen for this initiation. Reported results and disclosed operating developments are reflected only through the dated source ledger and analyst assumptions.

14

Capital Allocation and Governance

Capital allocation

The model gives priority to balance-sheet capacity, reinvestment needs and cash conversion. Net cash is added in DCF, but only once; it is not also capitalized through the earnings multiple.

Expansion capex is explicitly deducted from FCFF in the year it is expected to be spent. A project can be strategically attractive and still reduce near-term free cash flow.

Governance stance

Reported actuals, research-cut dates, evidence hashes and approved ratings are outside the chatbot edit surface. Narrative and assumptions may change only through a validated, versioned patch.

Private contracts, complete customer rosters and undisclosed order economics remain unknown rather than estimated as facts.

Comparable-company screen

CompanyWhy includedHow used
SK hynixMemory and HBM peerHBM execution, memory pricing and cycle comparison
Micron TechnologyGlobal memory peerDRAM/NAND pricing, capex and supply response
TSMCFoundry benchmarkAdvanced-node utilization and manufacturing economics; business mix differs
ApplePremium device ecosystem benchmarkPremium mobile demand and ecosystem economics; semiconductor model differs
15

Methodology, Sources and Disclosures

Evidence classes

Reported: official filing or exchange disclosure. Derived: deterministic calculation from reported figures. Forecast: model output using disclosed assumptions. Judgment: analyst interpretation. Scenario: bounded alternative, not a prediction.

Source ledger

SourceDateUseStatus
Samsung Electronics Q1 2026 earnings presentation2026-04-30Latest complete official financial, segment and outlook presentationavailable
Samsung Electronics Q2 2026 earnings guidance2026-07-07Official Q2 Revenue and operating-profit guidanceavailable
Samsung Electronics Q4 and FY2025 earnings presentation2026-01-29FY2025 results and comparative segment dataavailable
Samsung Electronics 57th AGM results2026-03-18Audited FY2025 totals, EPS and dividendsavailable
FMP structured Samsung market and financial snapshot2026-08-04Price, normalized history, provider estimates and provisional Q2 componentsavailable
Argus Samsung point-in-time statistical forecast control2026-08-04Expanding-window Revenue/EPS backtest and Q3 controlavailable
Argus verified Samsung Electronics company-twin release2026-07-26Evidence-backed products, facilities, partners, risks and relationshipsavailable
Samsung begins commercial HBM4 shipments2026-02-12First-party HBM4 product imagery and product-status evidenceavailable
Samsung and AMD expand AI-memory collaboration2026-03-18First-party partner and HBM4 deployment evidenceavailable
Samsung unveils the Galaxy S26 series2026-02-26First-party mobile product imageryavailable
Samsung semiconductor operations photo essay2017-11-10First-party semiconductor manufacturing and campus imageryavailable
HARMAN agreement to acquire ZF's ADAS business2025-12-23First-party automotive technology and portfolio evidenceavailable
Customer allocation, HBM pricing, yields and foundry contractsKnown data gapknown_gap

Forecast governance

The point-in-time statistical baseline is frozen before event scenarios. Annual estimates use an explicit revenue-to-margin-to-EPS bridge. Events do not change the control forecast automatically; they create reviewable low/high deltas and require promotion into a new immutable version.

Limitations

  • Backtest histories are short and do not support strong claims of future accuracy.
  • Public disclosures do not reveal every customer, supplier, contract term or product-level margin.
  • Provider and extracted data are supporting evidence; official documents take precedence.
  • Valuation is sensitive to terminal growth, discount rates, multiples and the timing of operational assumptions.